Join Our Lunch & Learn: How Agentic AI Will Transform Industrial Operations | Register Now →
.svg)
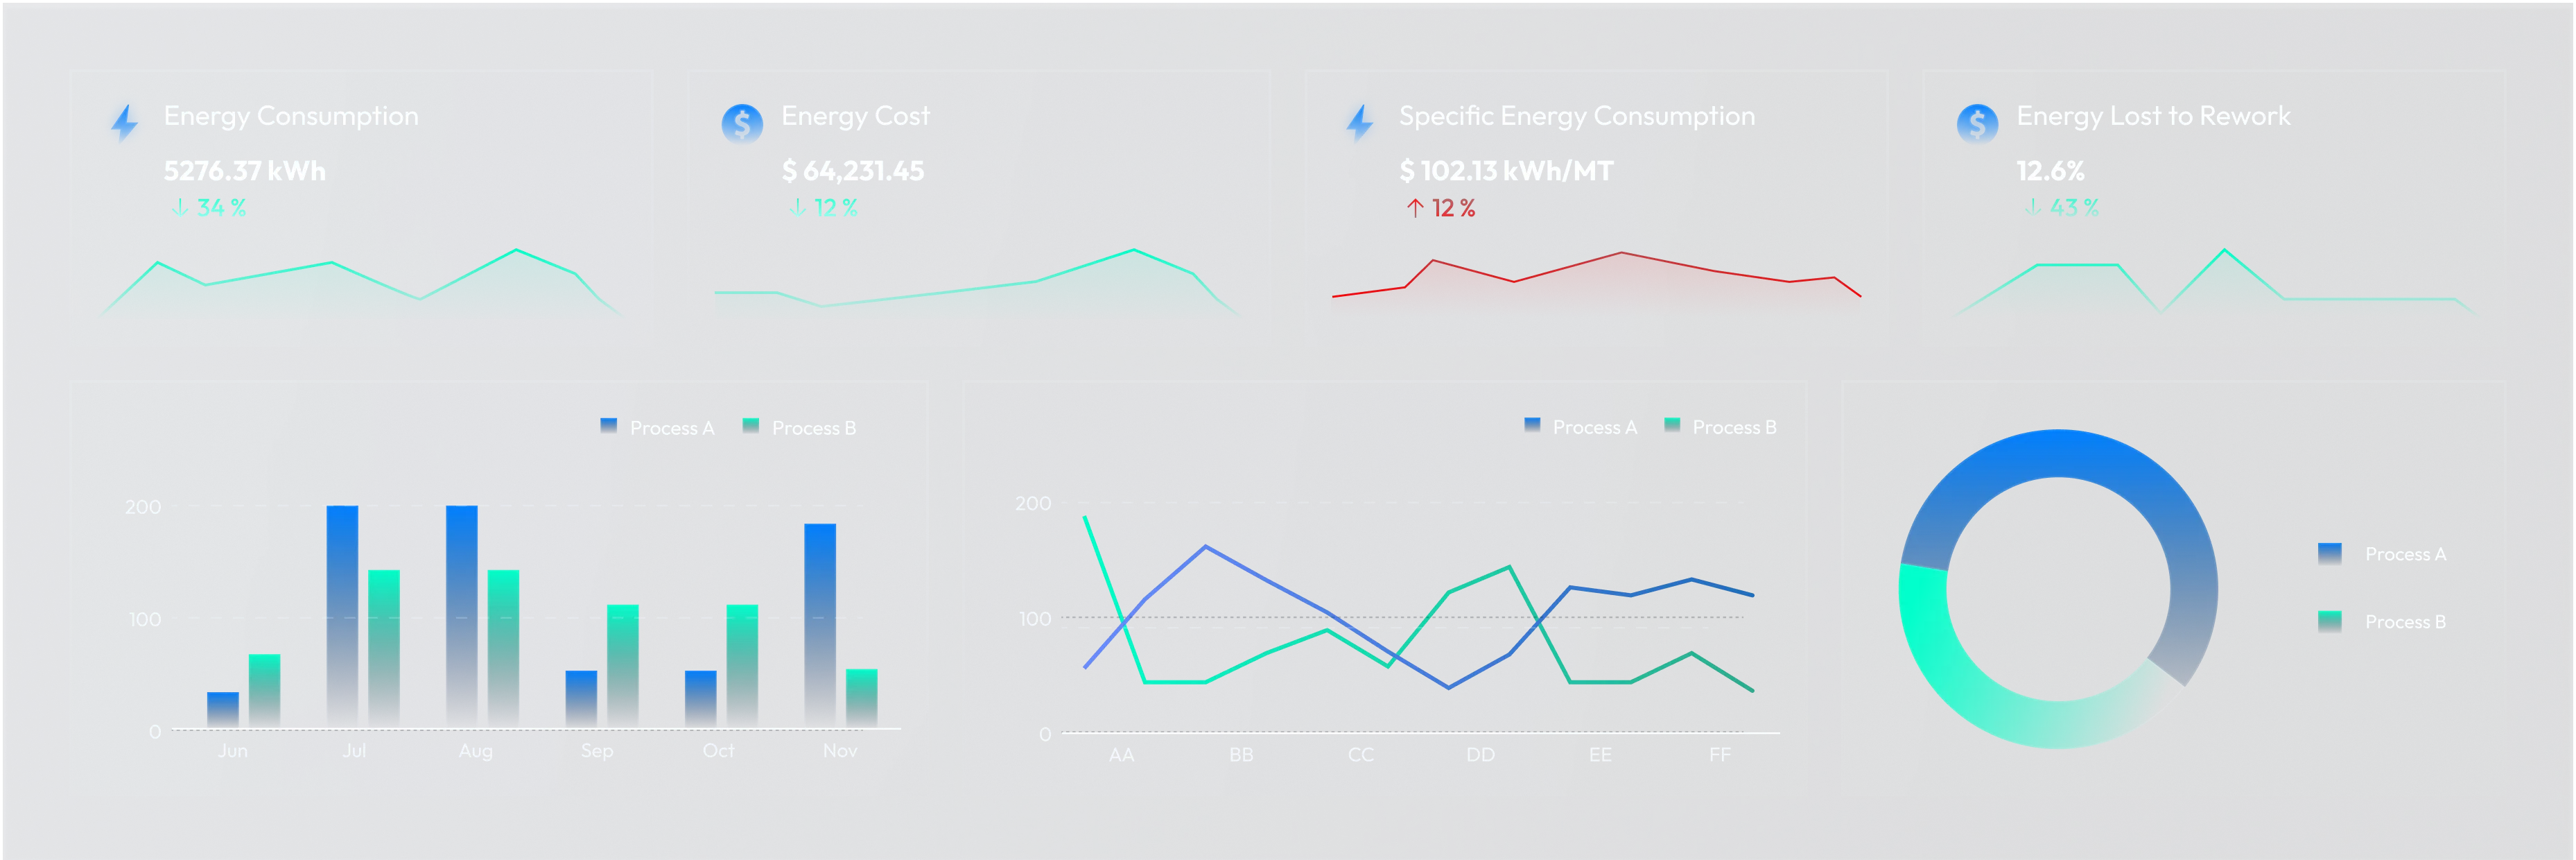
Explore the powerful features that transform raw industrial data into real-time intelligence, predictive workflows, and smarter decisions at every level of your operations
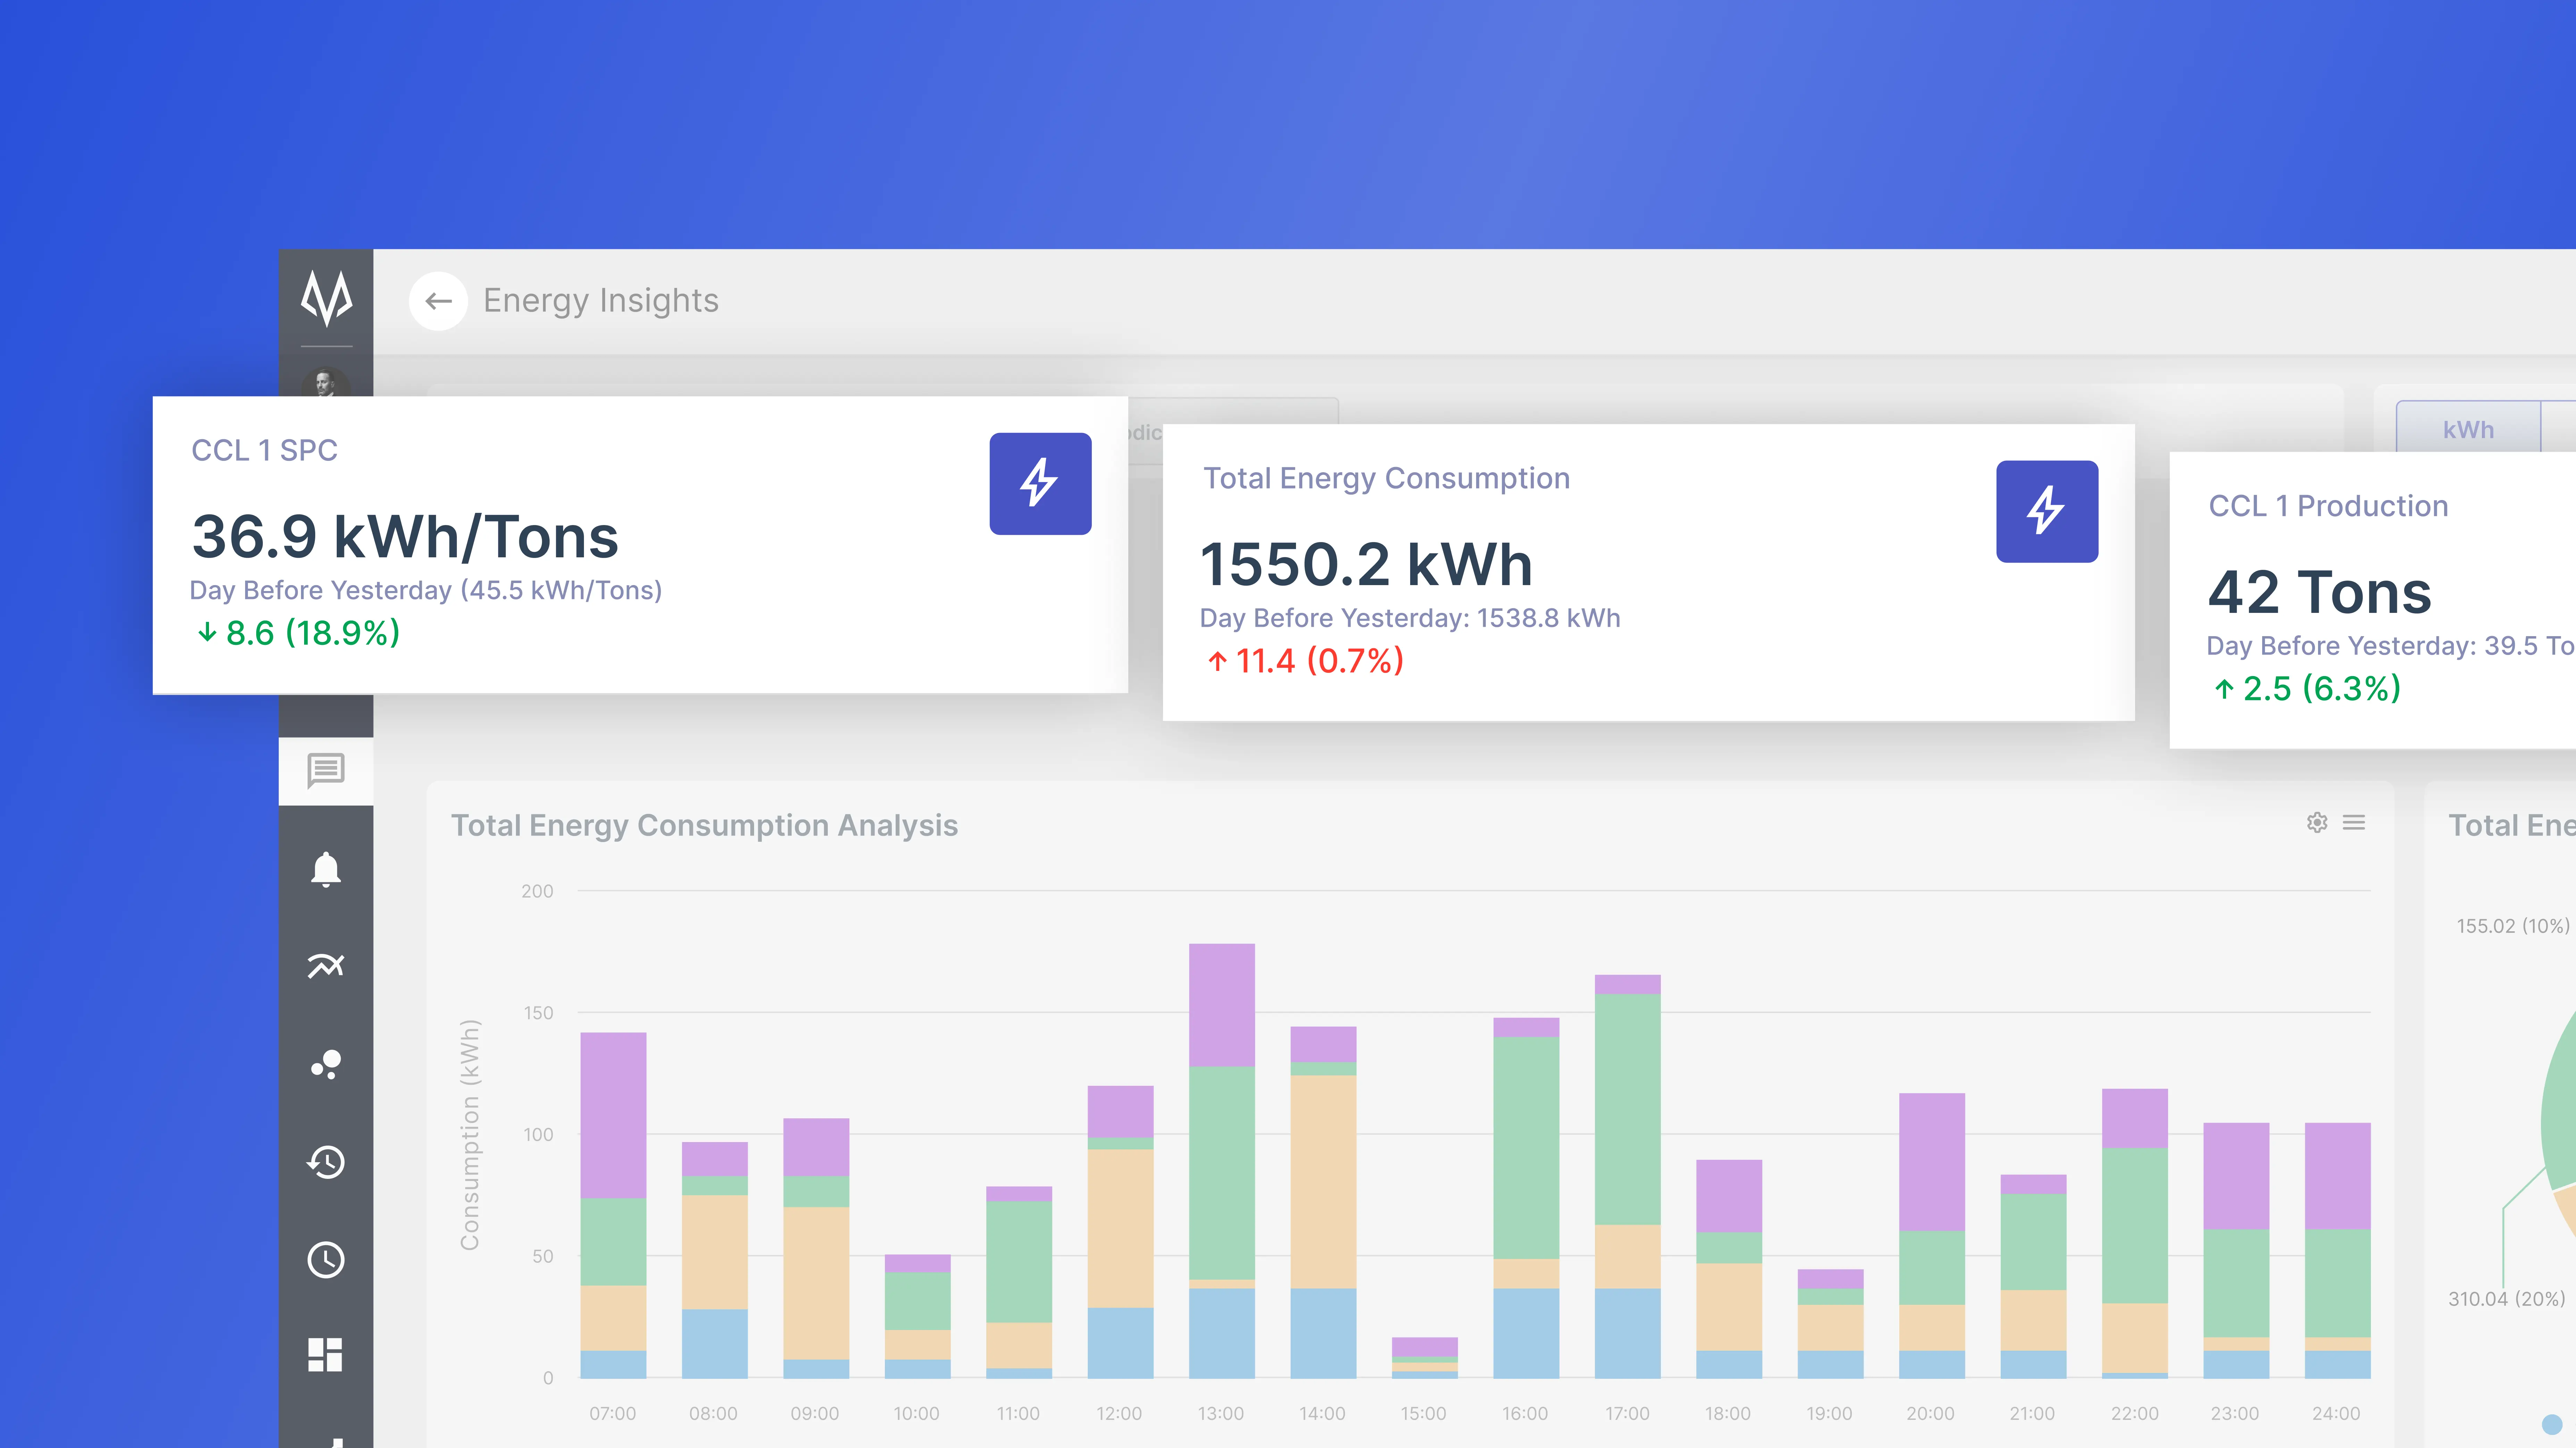
Prebuilt dashboards for rapid insight across production, energy, and maintenance.
Plug-and-play apps: OEE, steam trap monitoring, energy management, and more
Configure widgets and views with no-code tools
Live data updates for accurate, on-the-ground decision-making
Instant visibility into KPIs from plant floor to control room
Optimized for speed, scale, and cross-site use
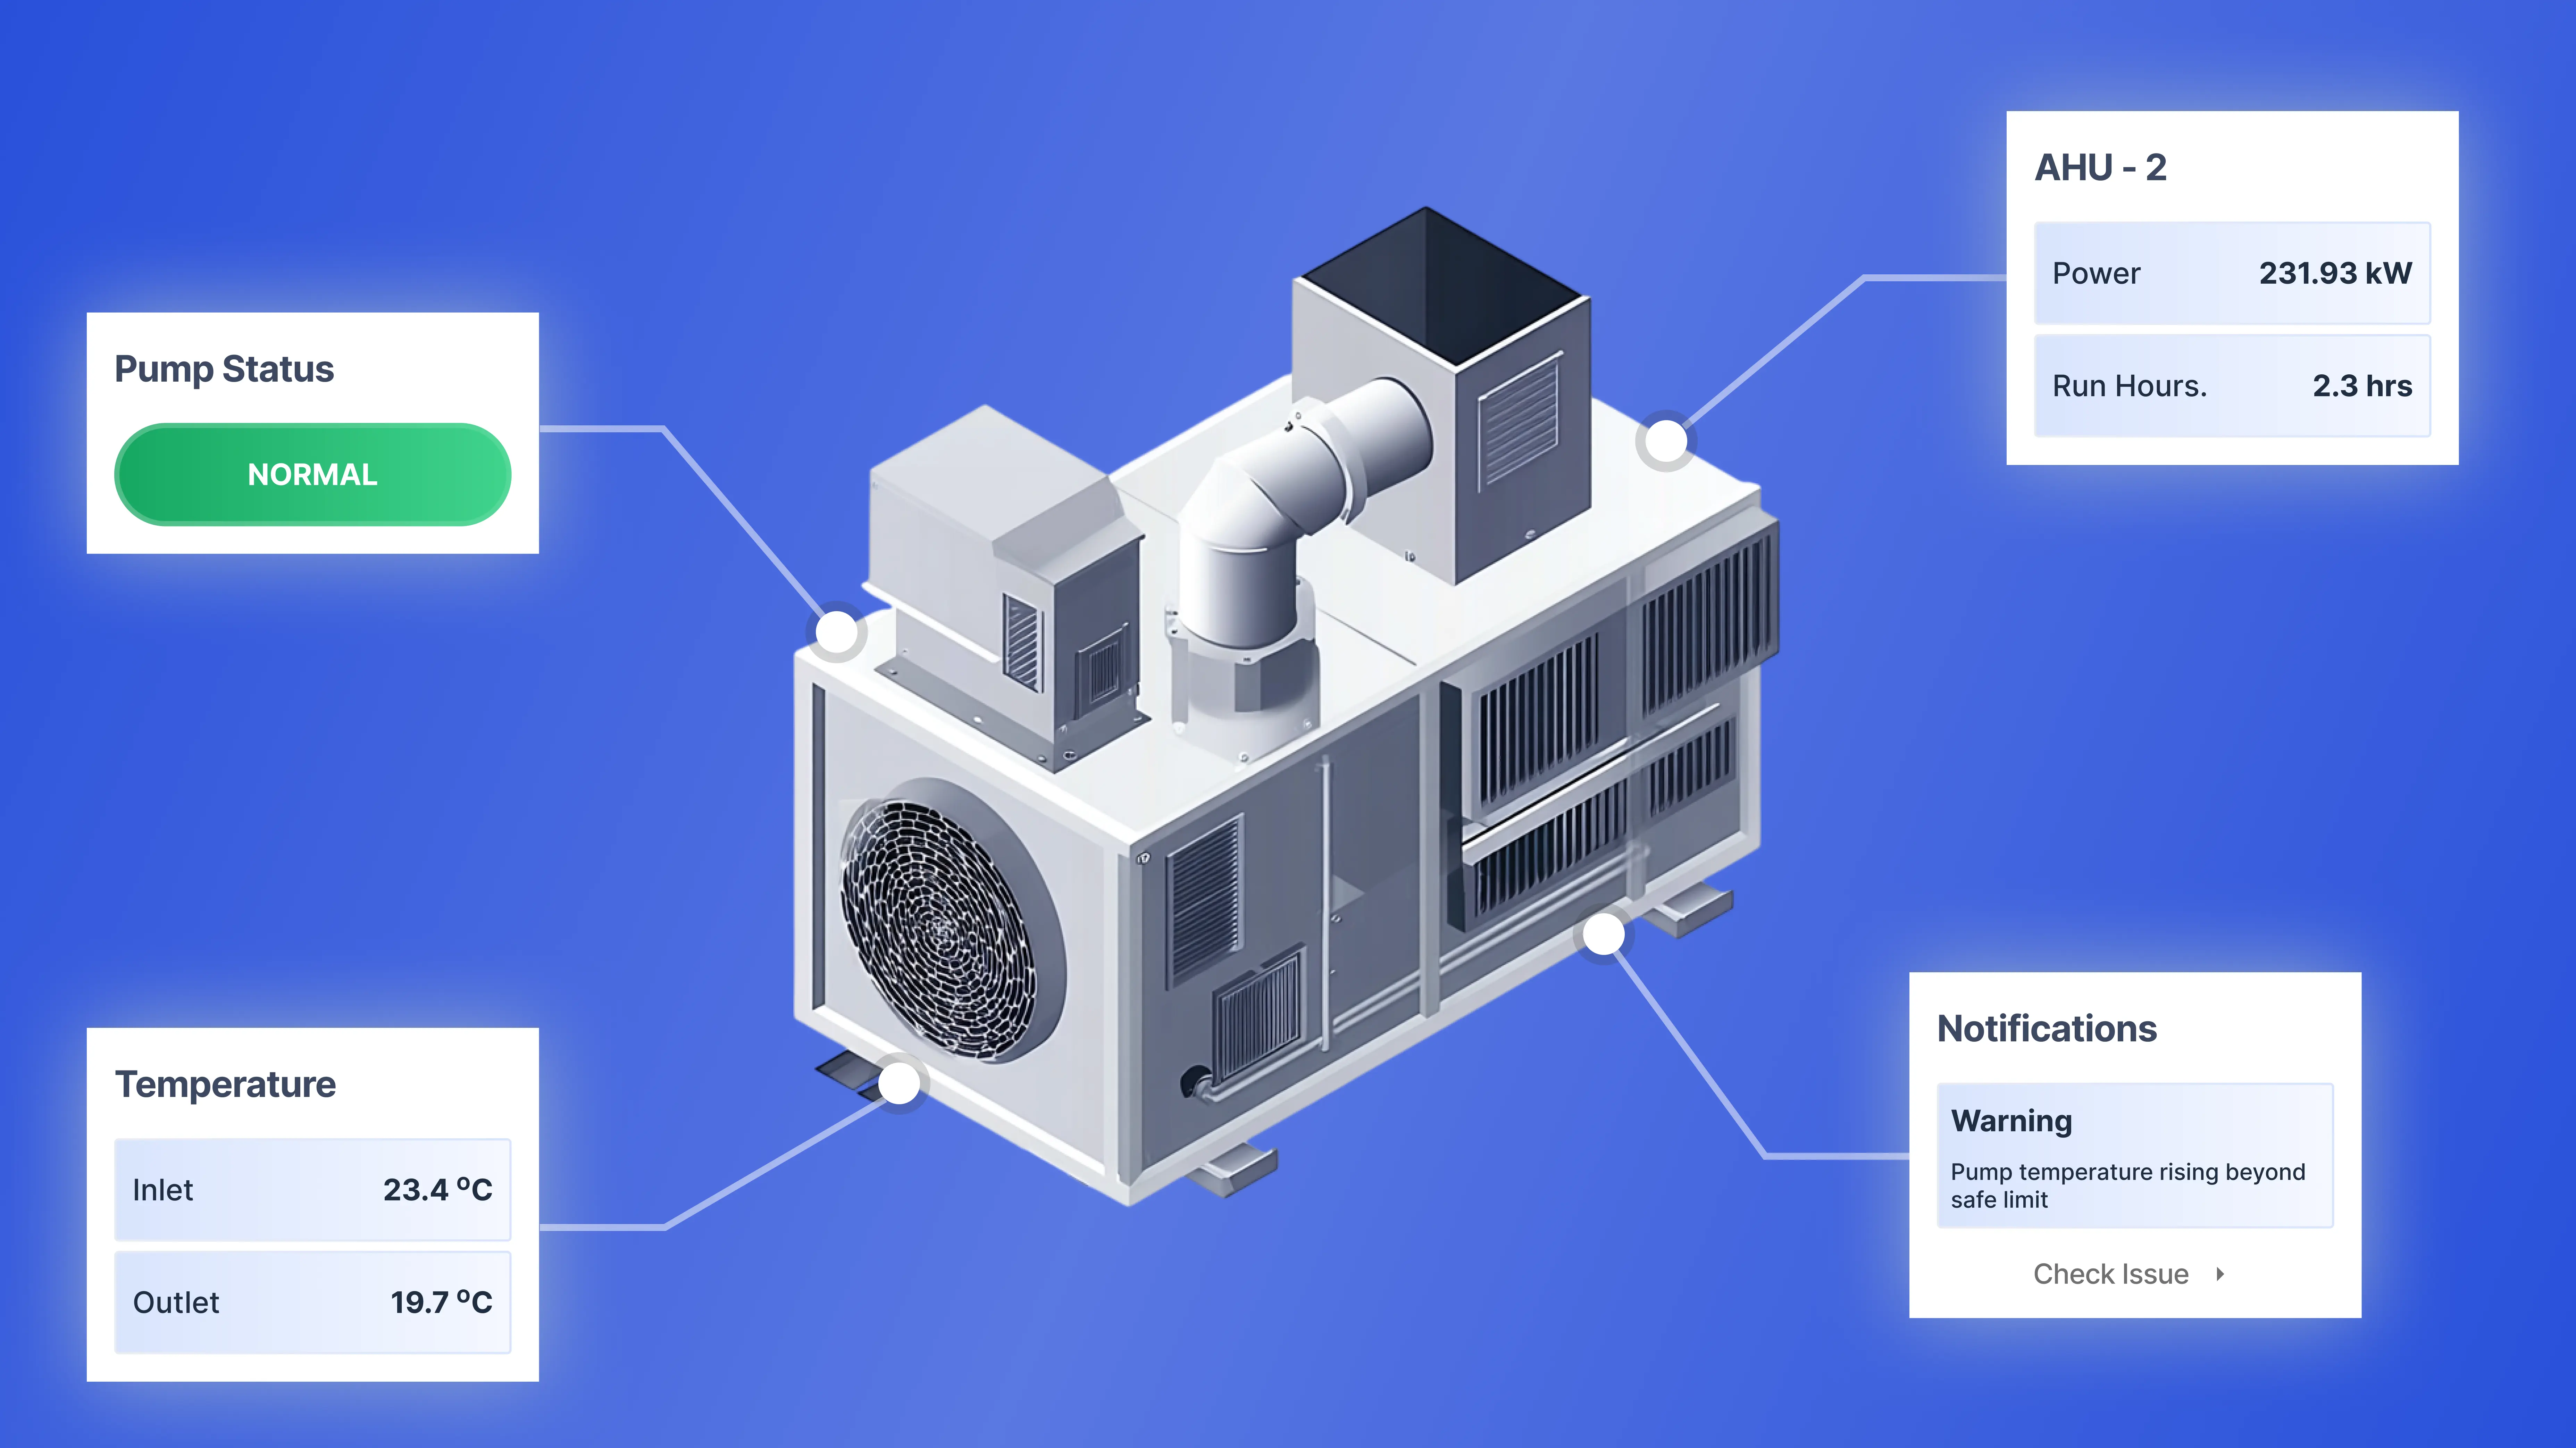
A rich canvas to visualize operations in 2D and 3D
Overlay sensor data on plant layouts, piping diagrams, or floorplans
Create spatial views for digital twins, production lines, and assets
Visualize alarms, metrics, and statuses in real-time
Combine multiple visual layers for contextual insight
Drag-and-drop customization to fit your operational flow
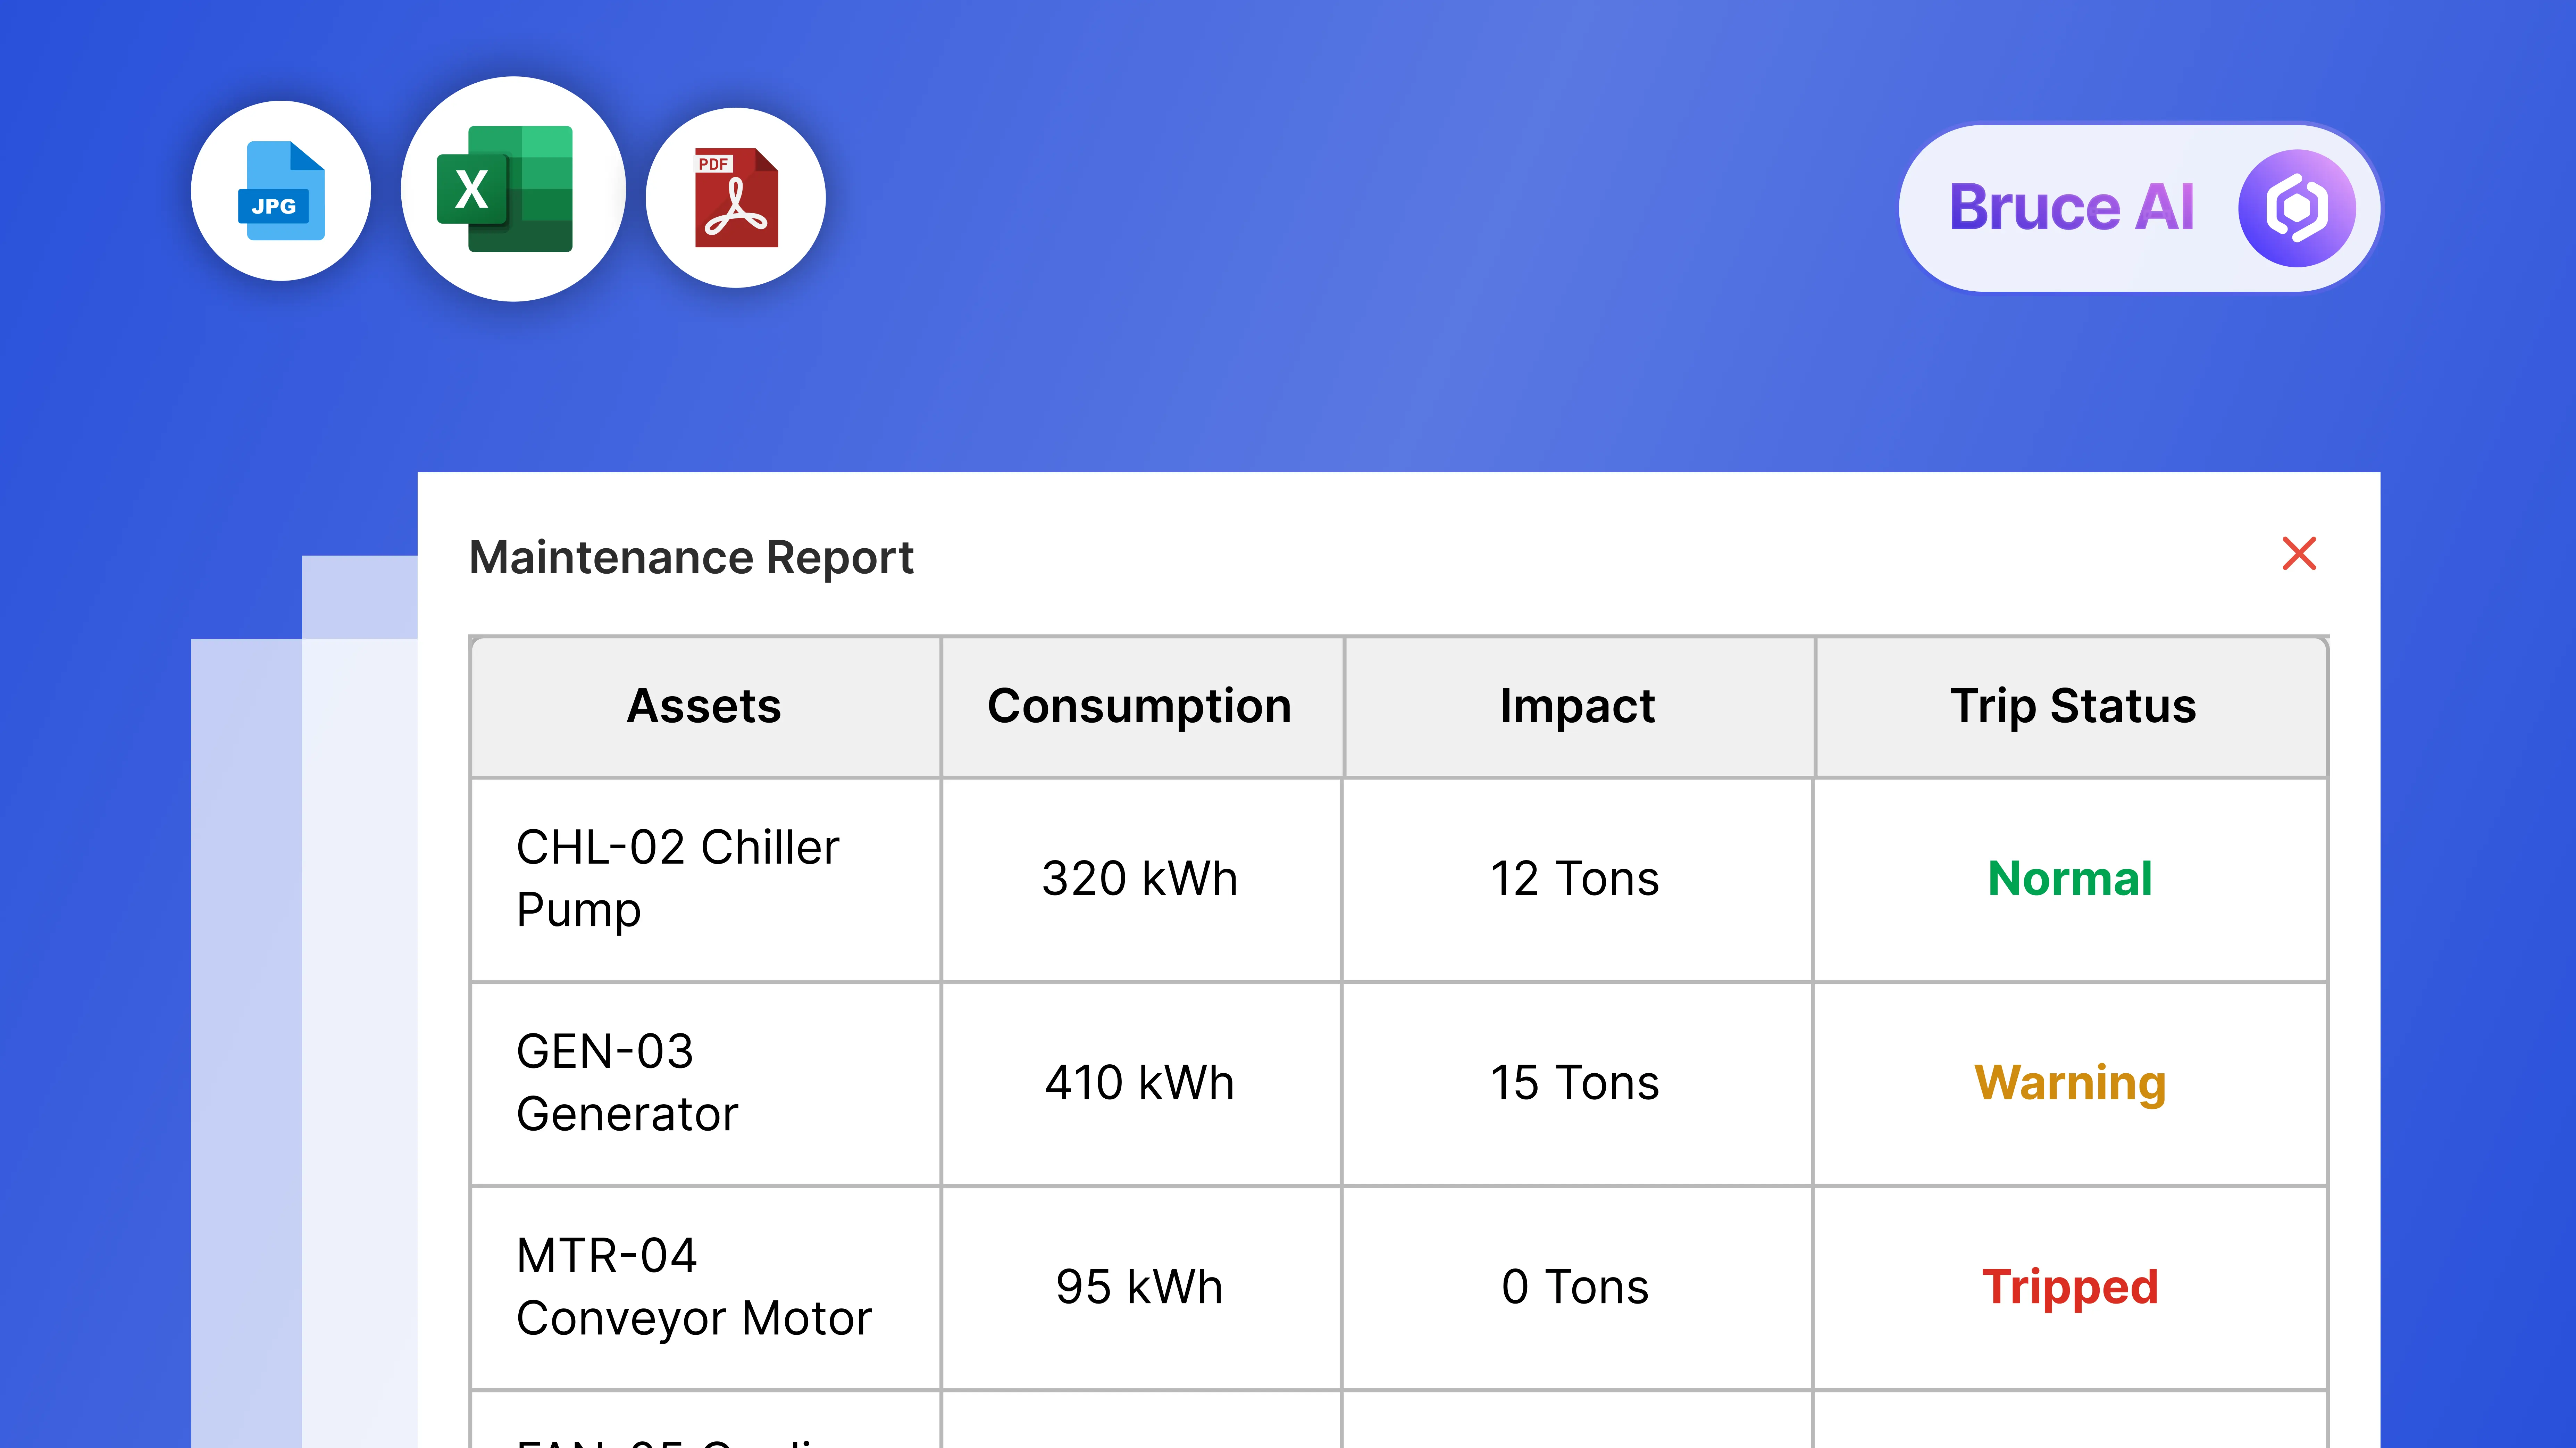
Automated reporting with embedded intelligence.
Create scheduled or on-demand reports from any dashboard
Export reports as PDFs, Excel files, or API outputs
Include AI-generated summaries using Bruce AI
Share reports via email or external tools
Visual consistency between reports and dashboards
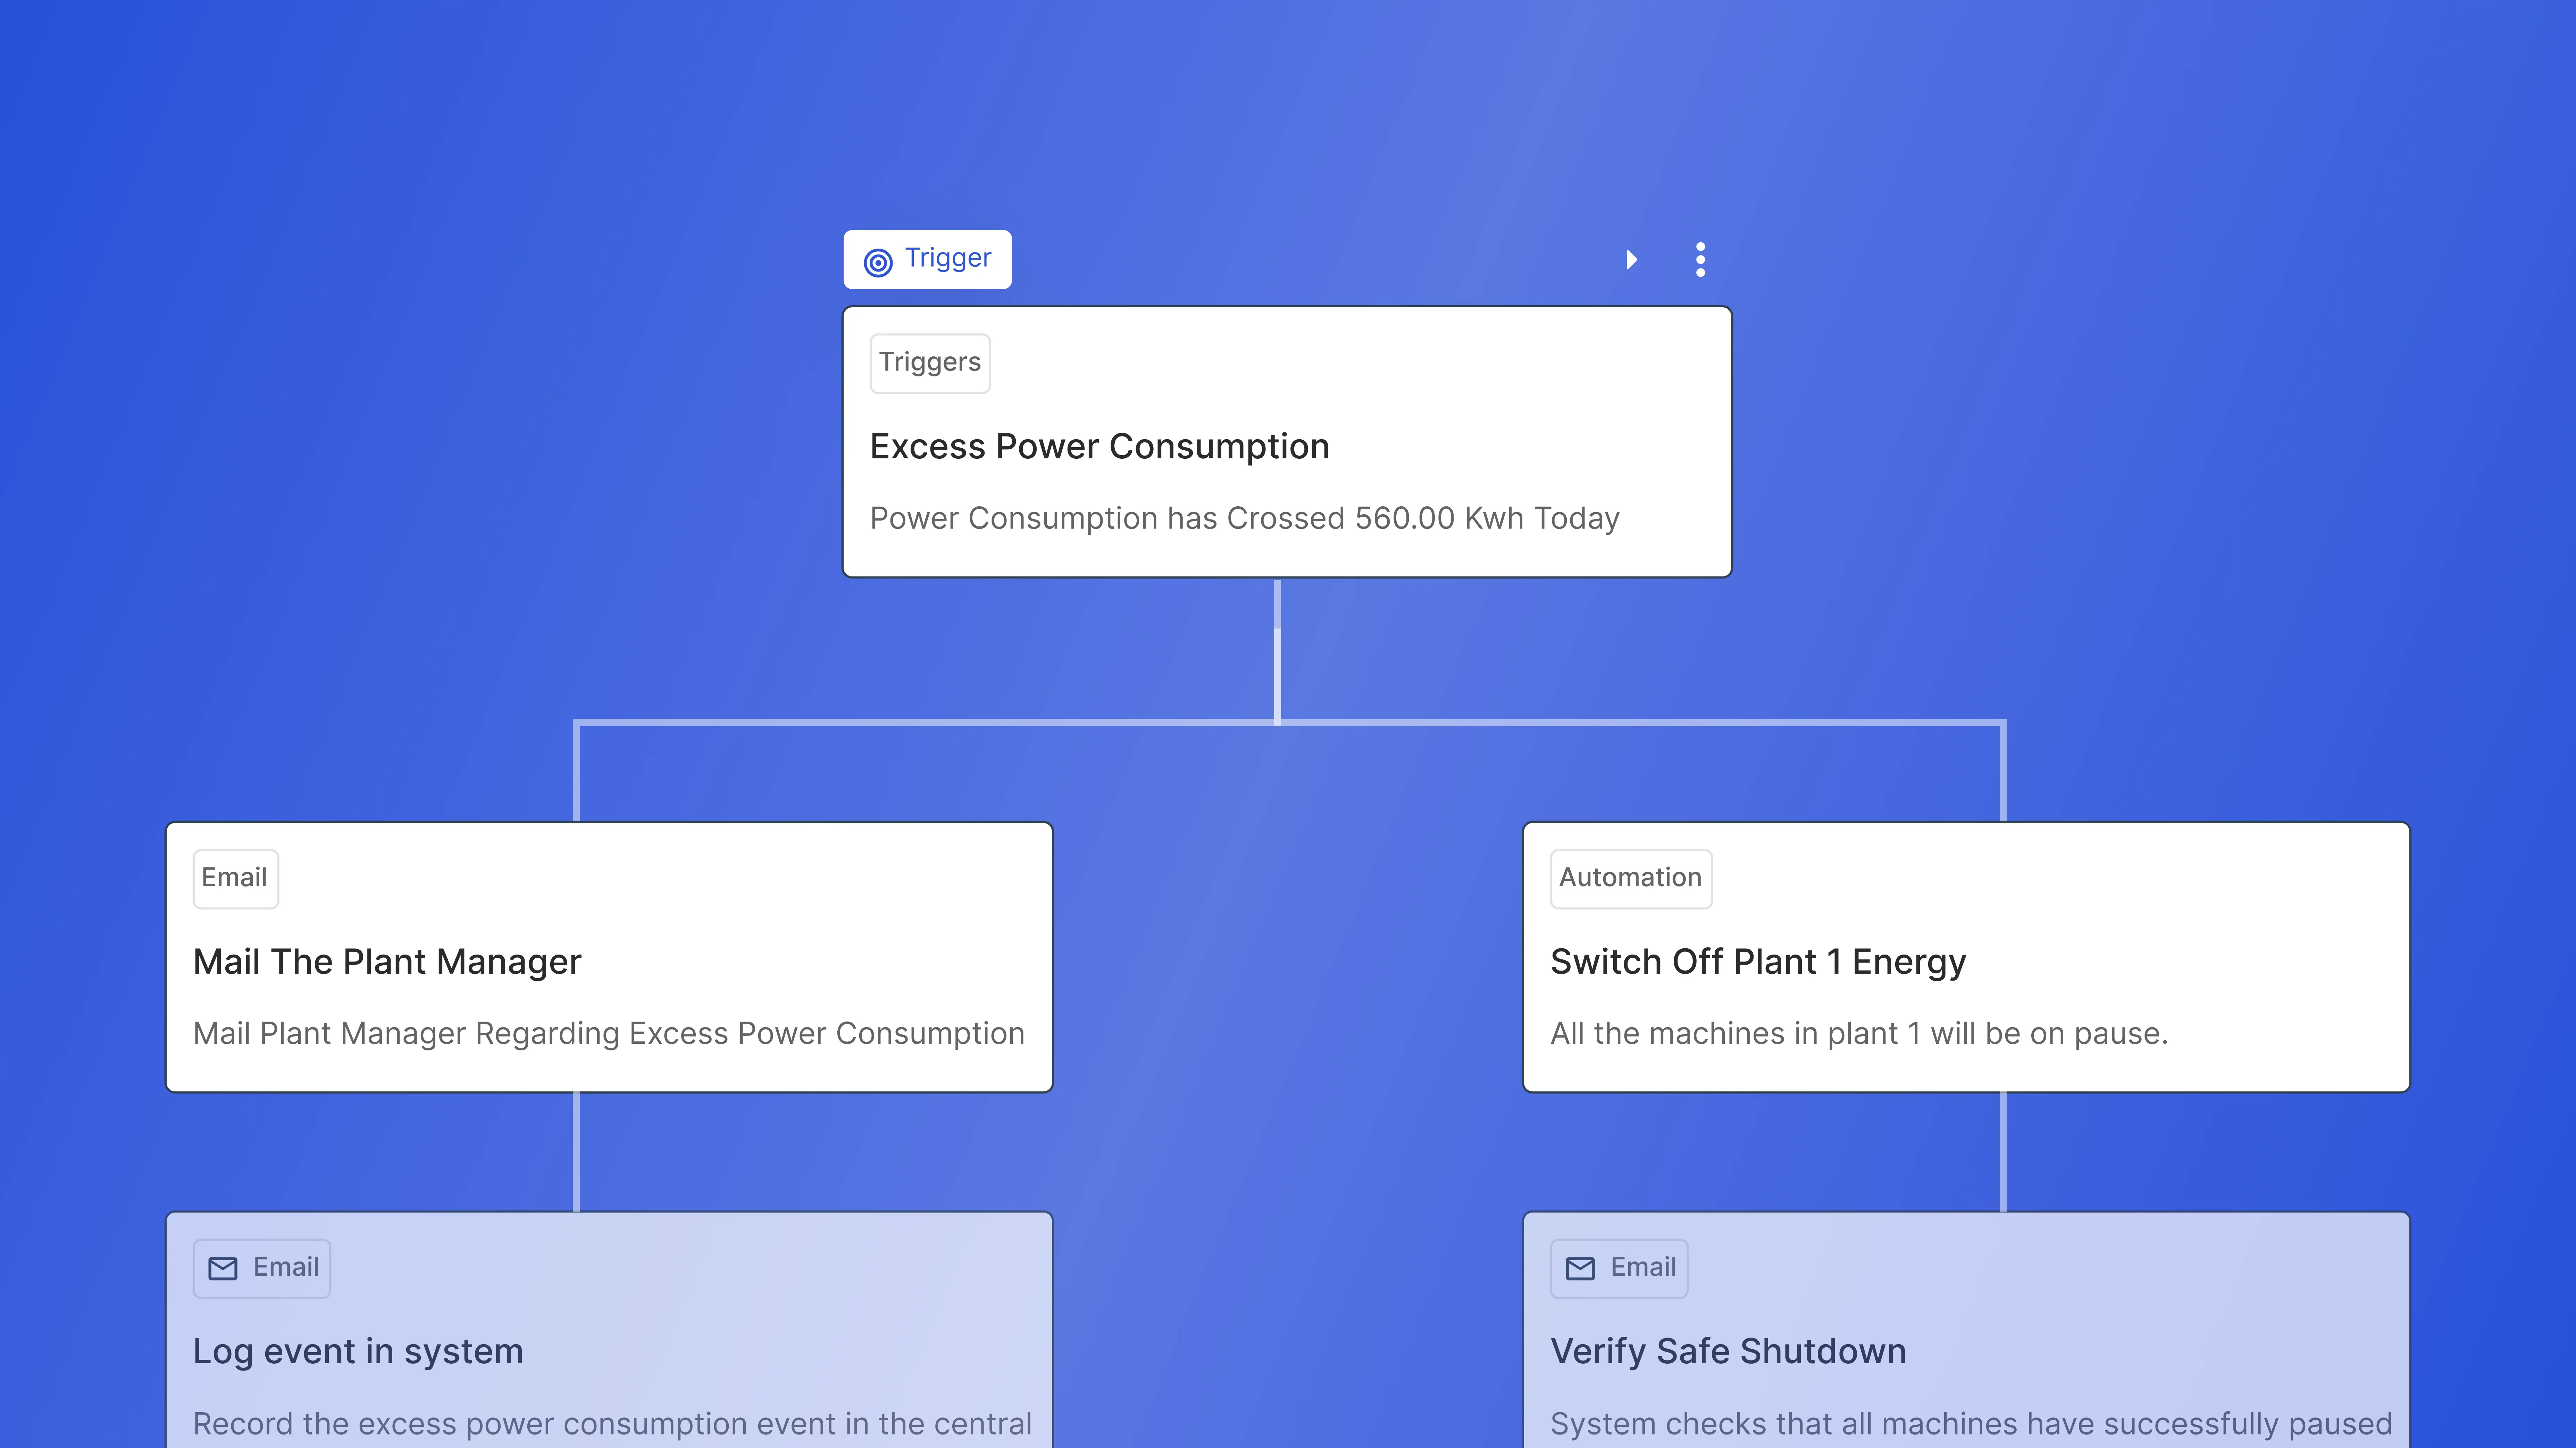
Turn data into action without writing code.
Build workflows visually with condition-based logic
Automate alerts, control actions, or notifications
Integrate third-party systems via API triggers
Monitor and audit real-time workflow execution
Deploy across equipment, production lines, or utilities
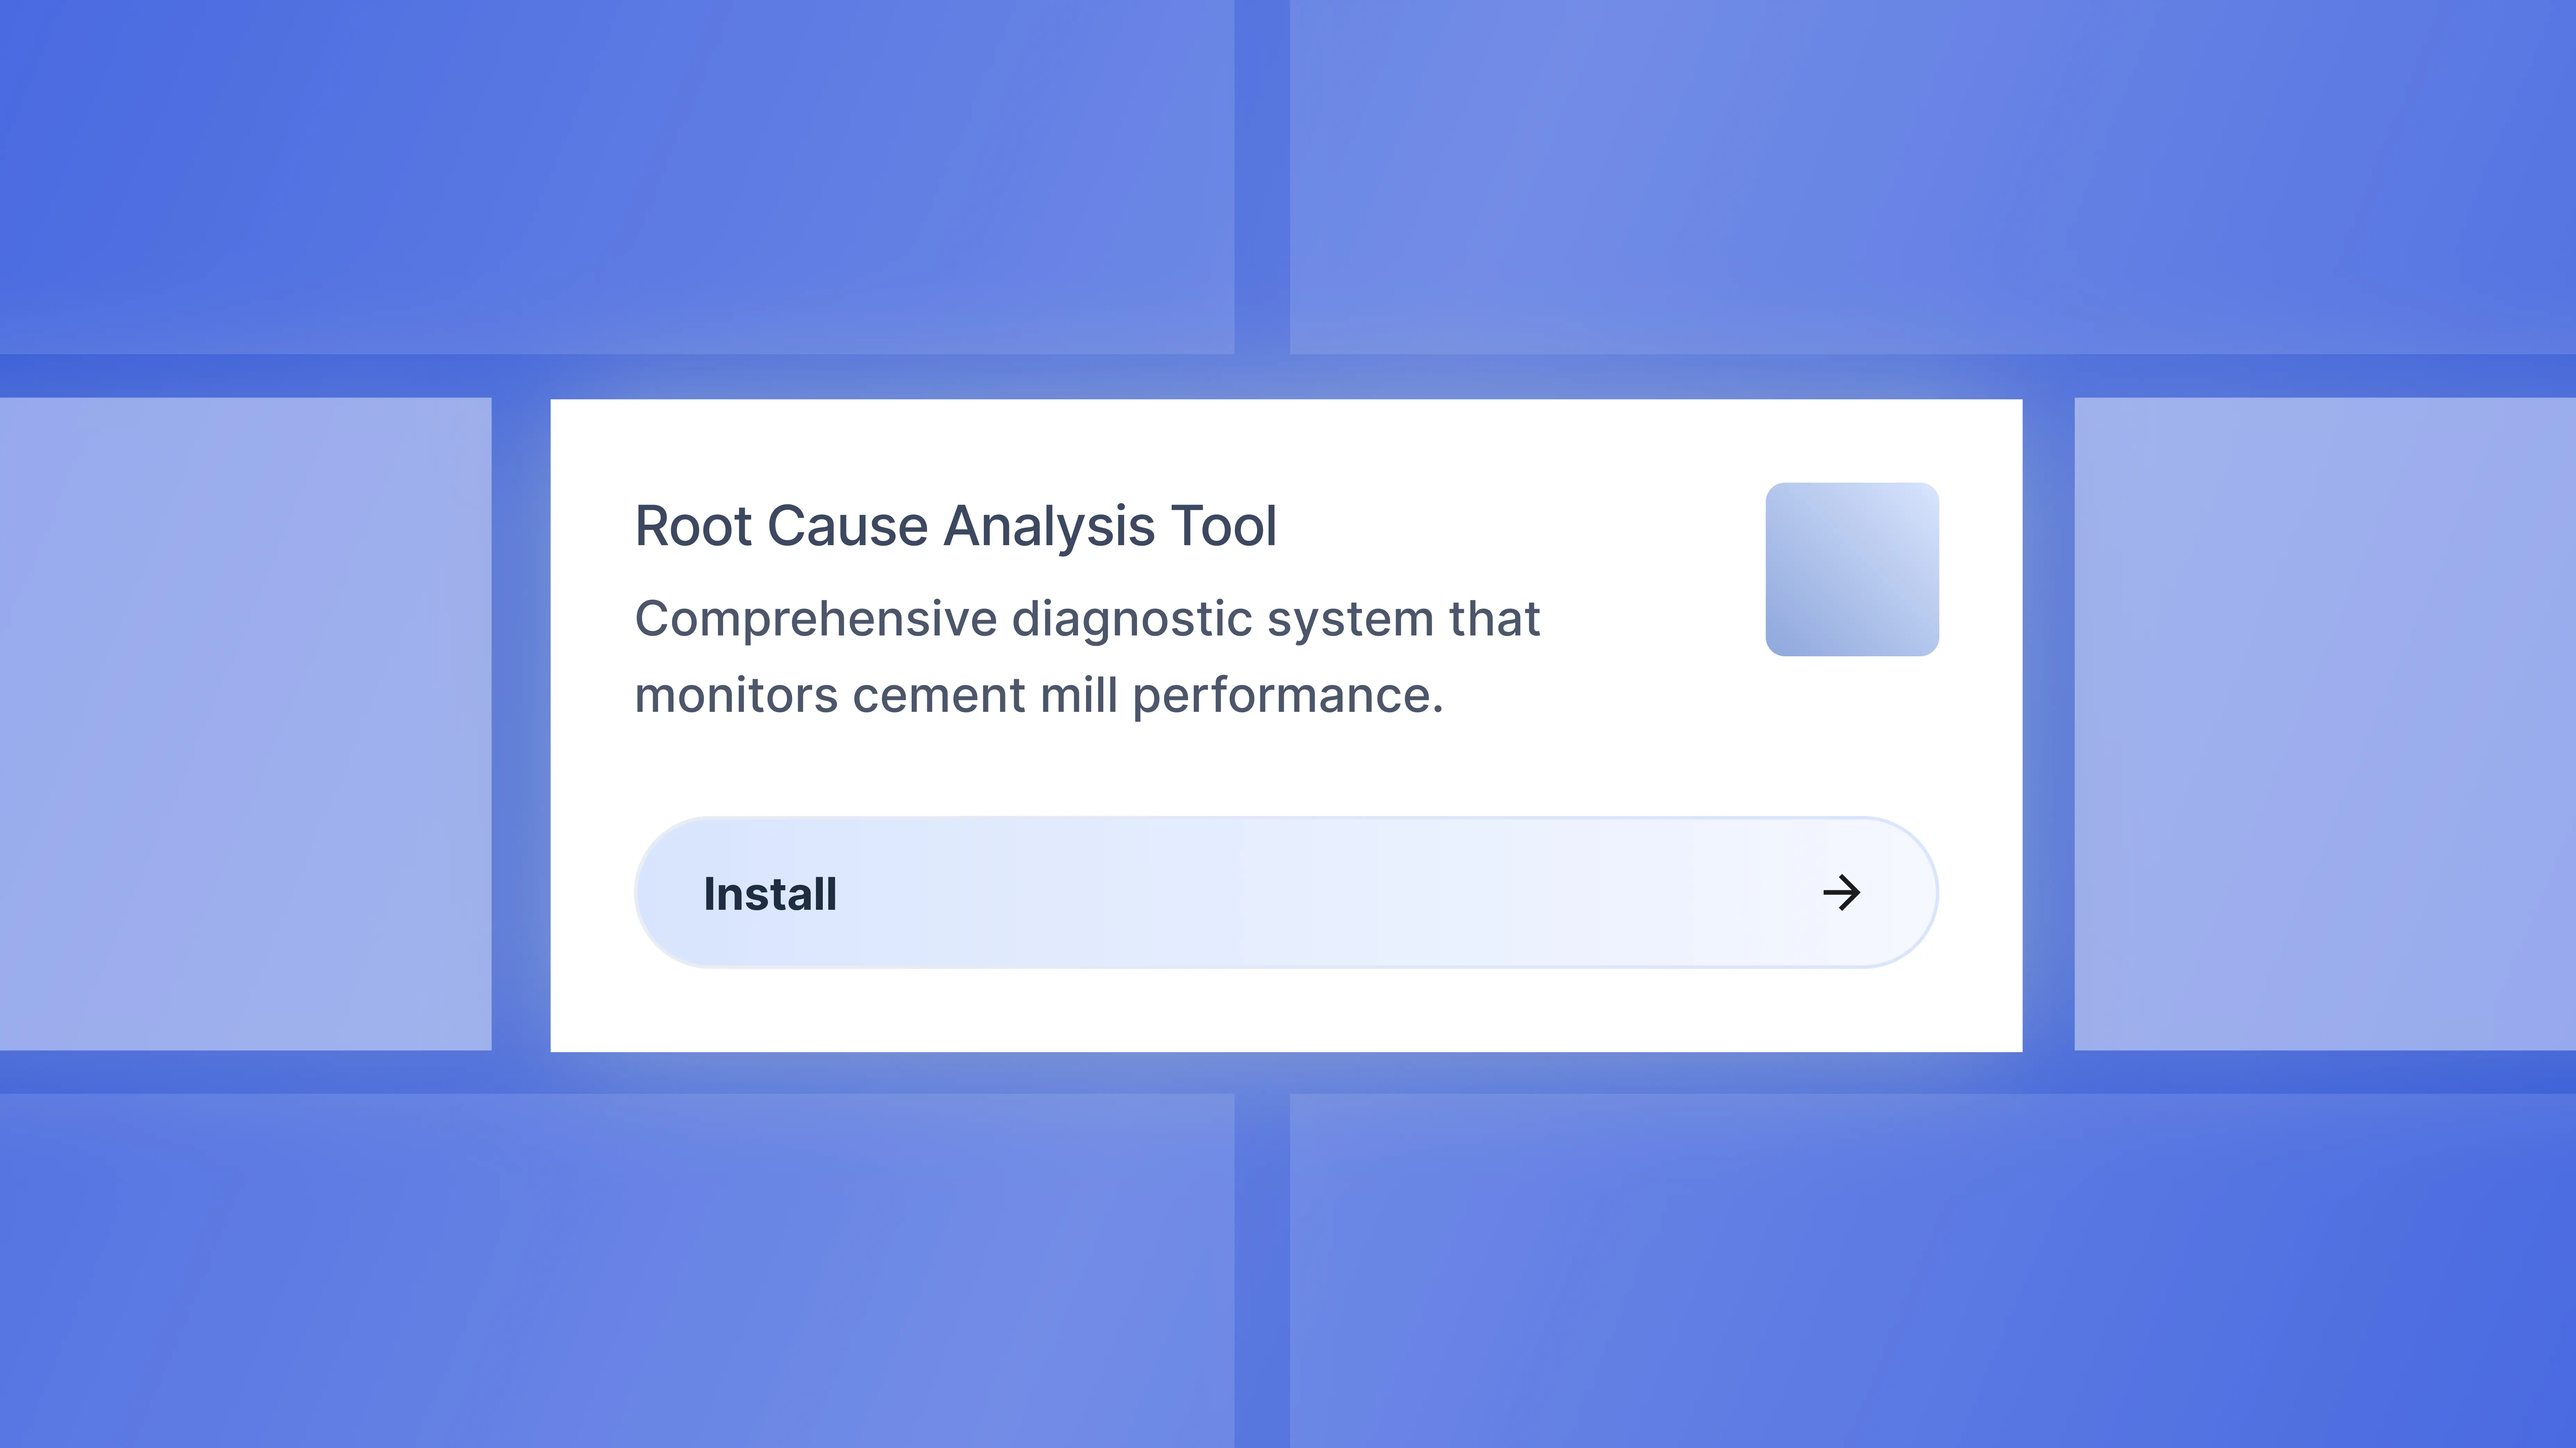
One-click deployment of Faclon’s industry apps.
Install ready-made apps for energy, asset health, water, steam, etc.
Combine apps into a site-wide operations control center
Configure each app to match site layout and asset types
Update and extend apps without rewriting dashboards
Launch new apps via centralized interface
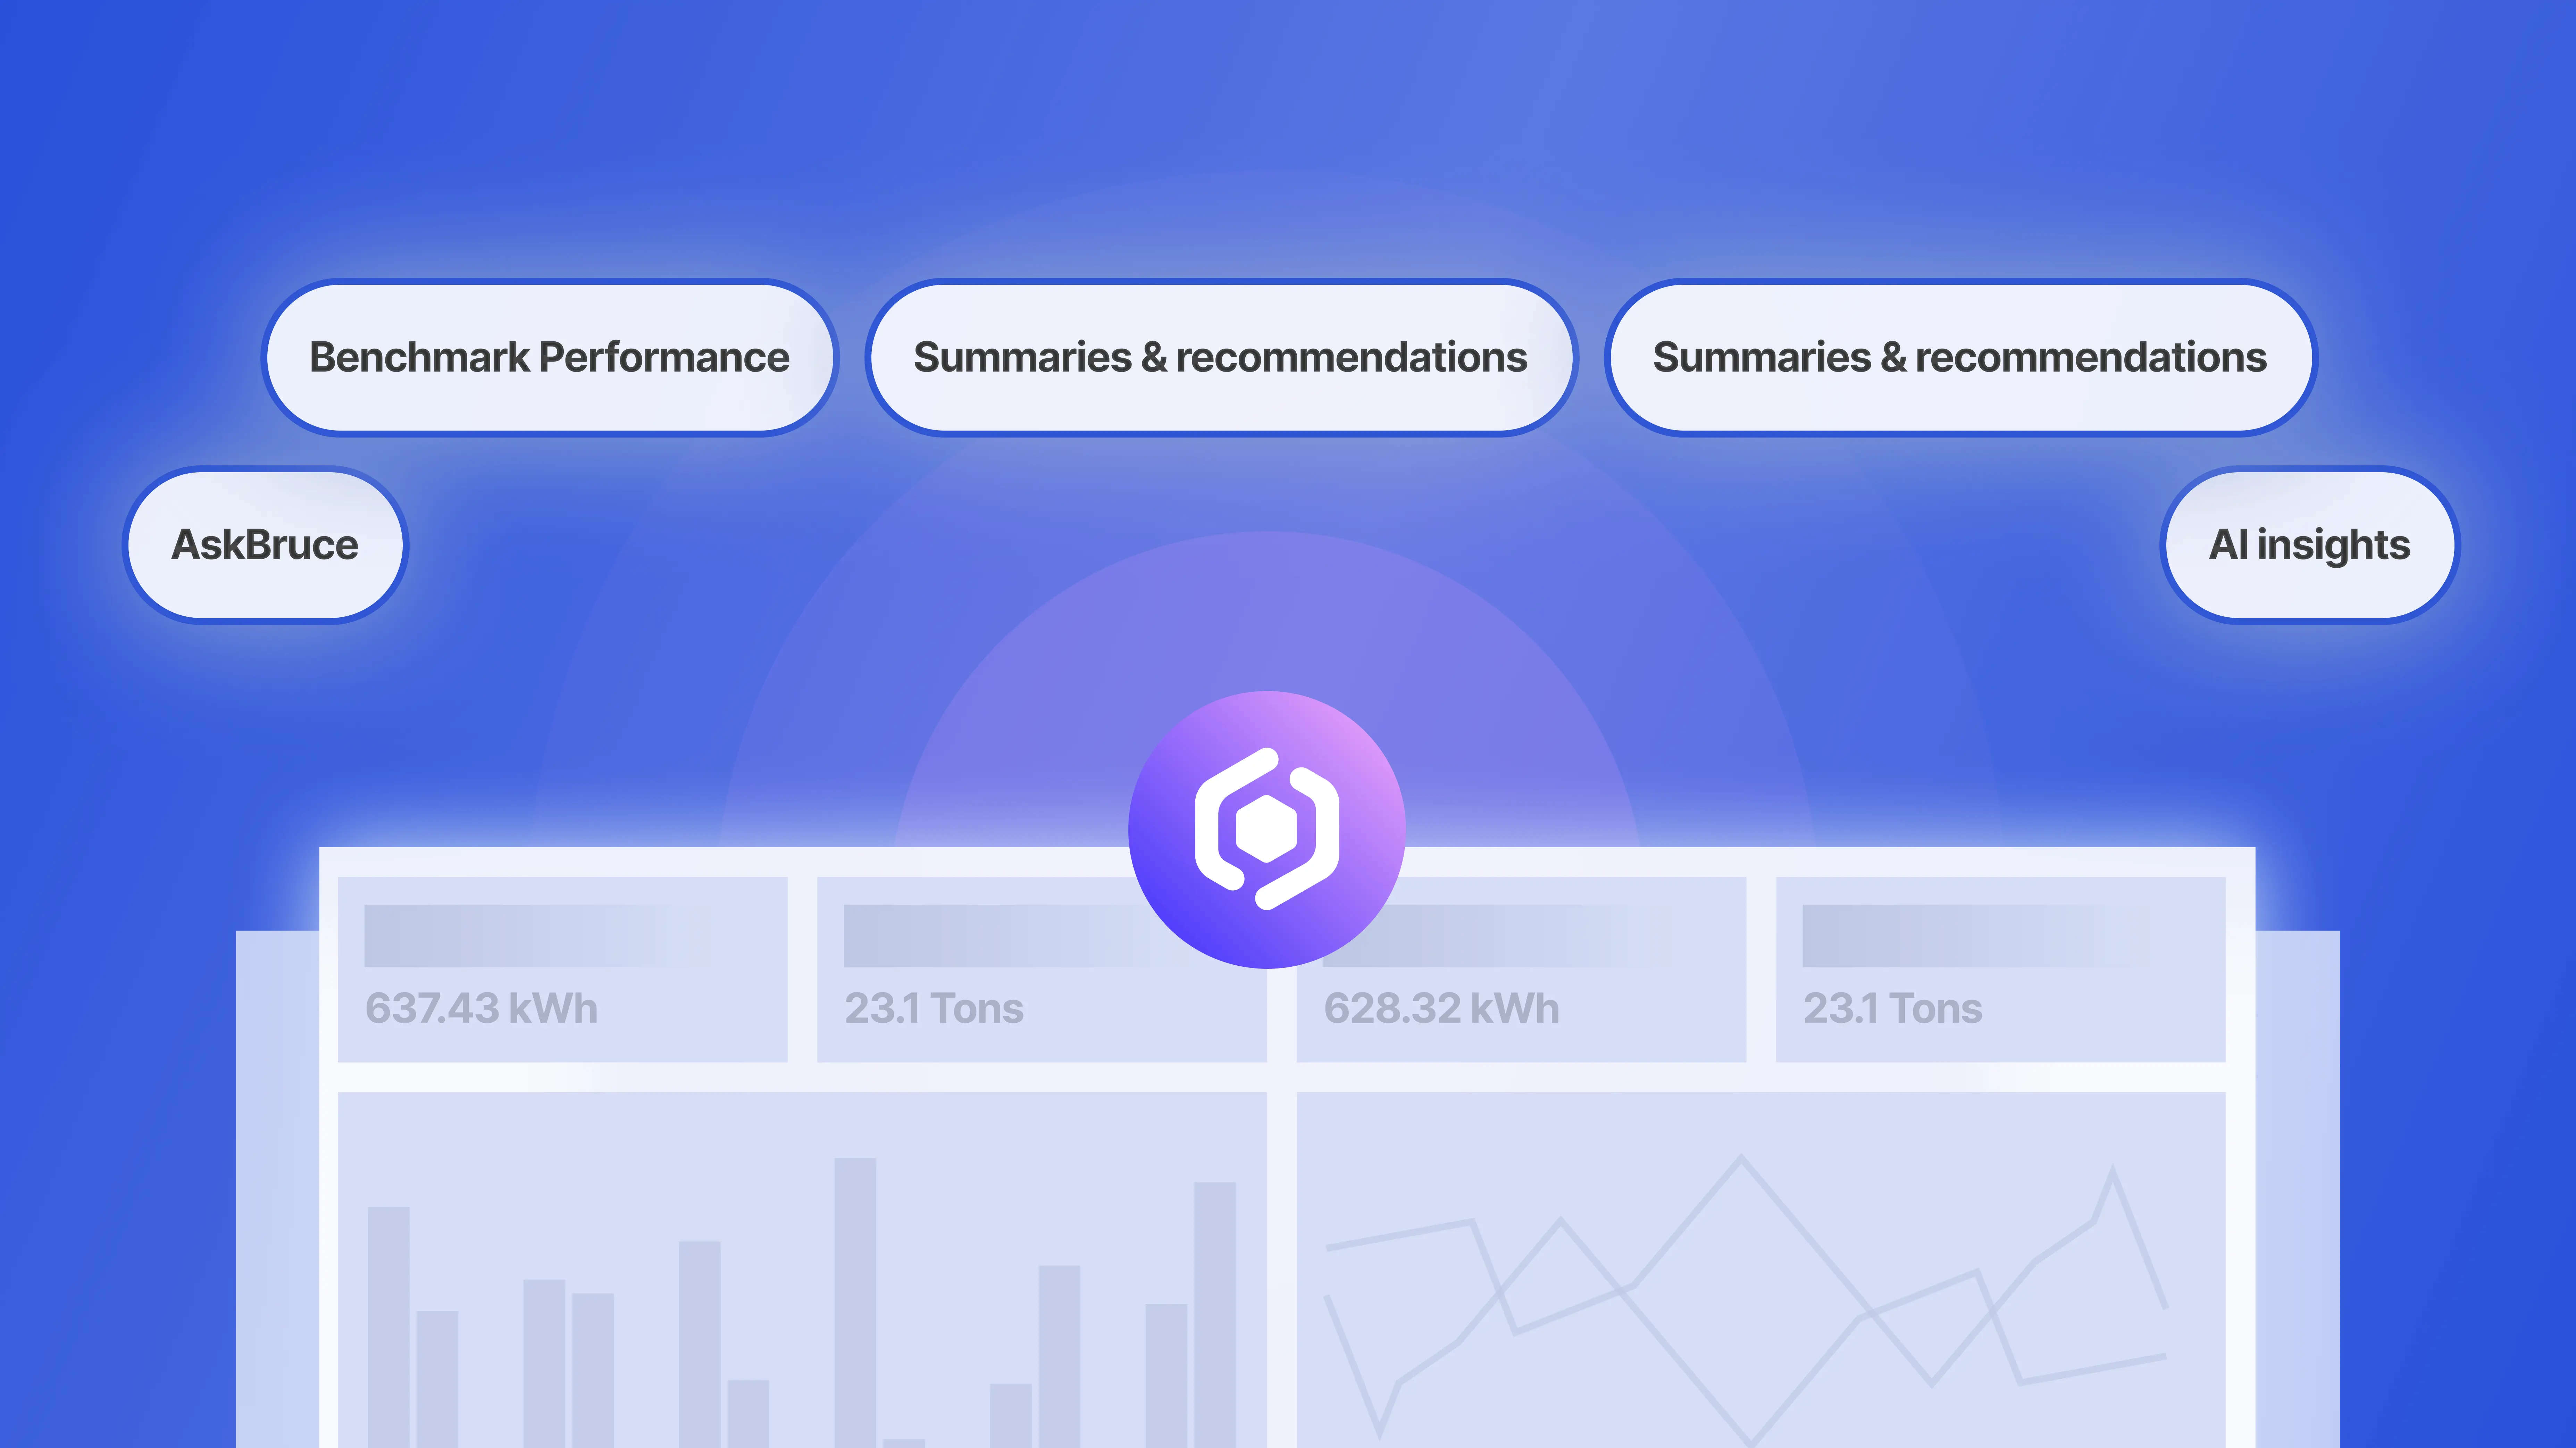
Let AI deliver clarity — right where decisions happen
Explain anomalies and performance shifts in simple language
Benchmark performance across time or peer plants
Generate narrative summaries and recommendations
AskBruce: query operations in natural language
AI insights embedded directly into widgets and reports
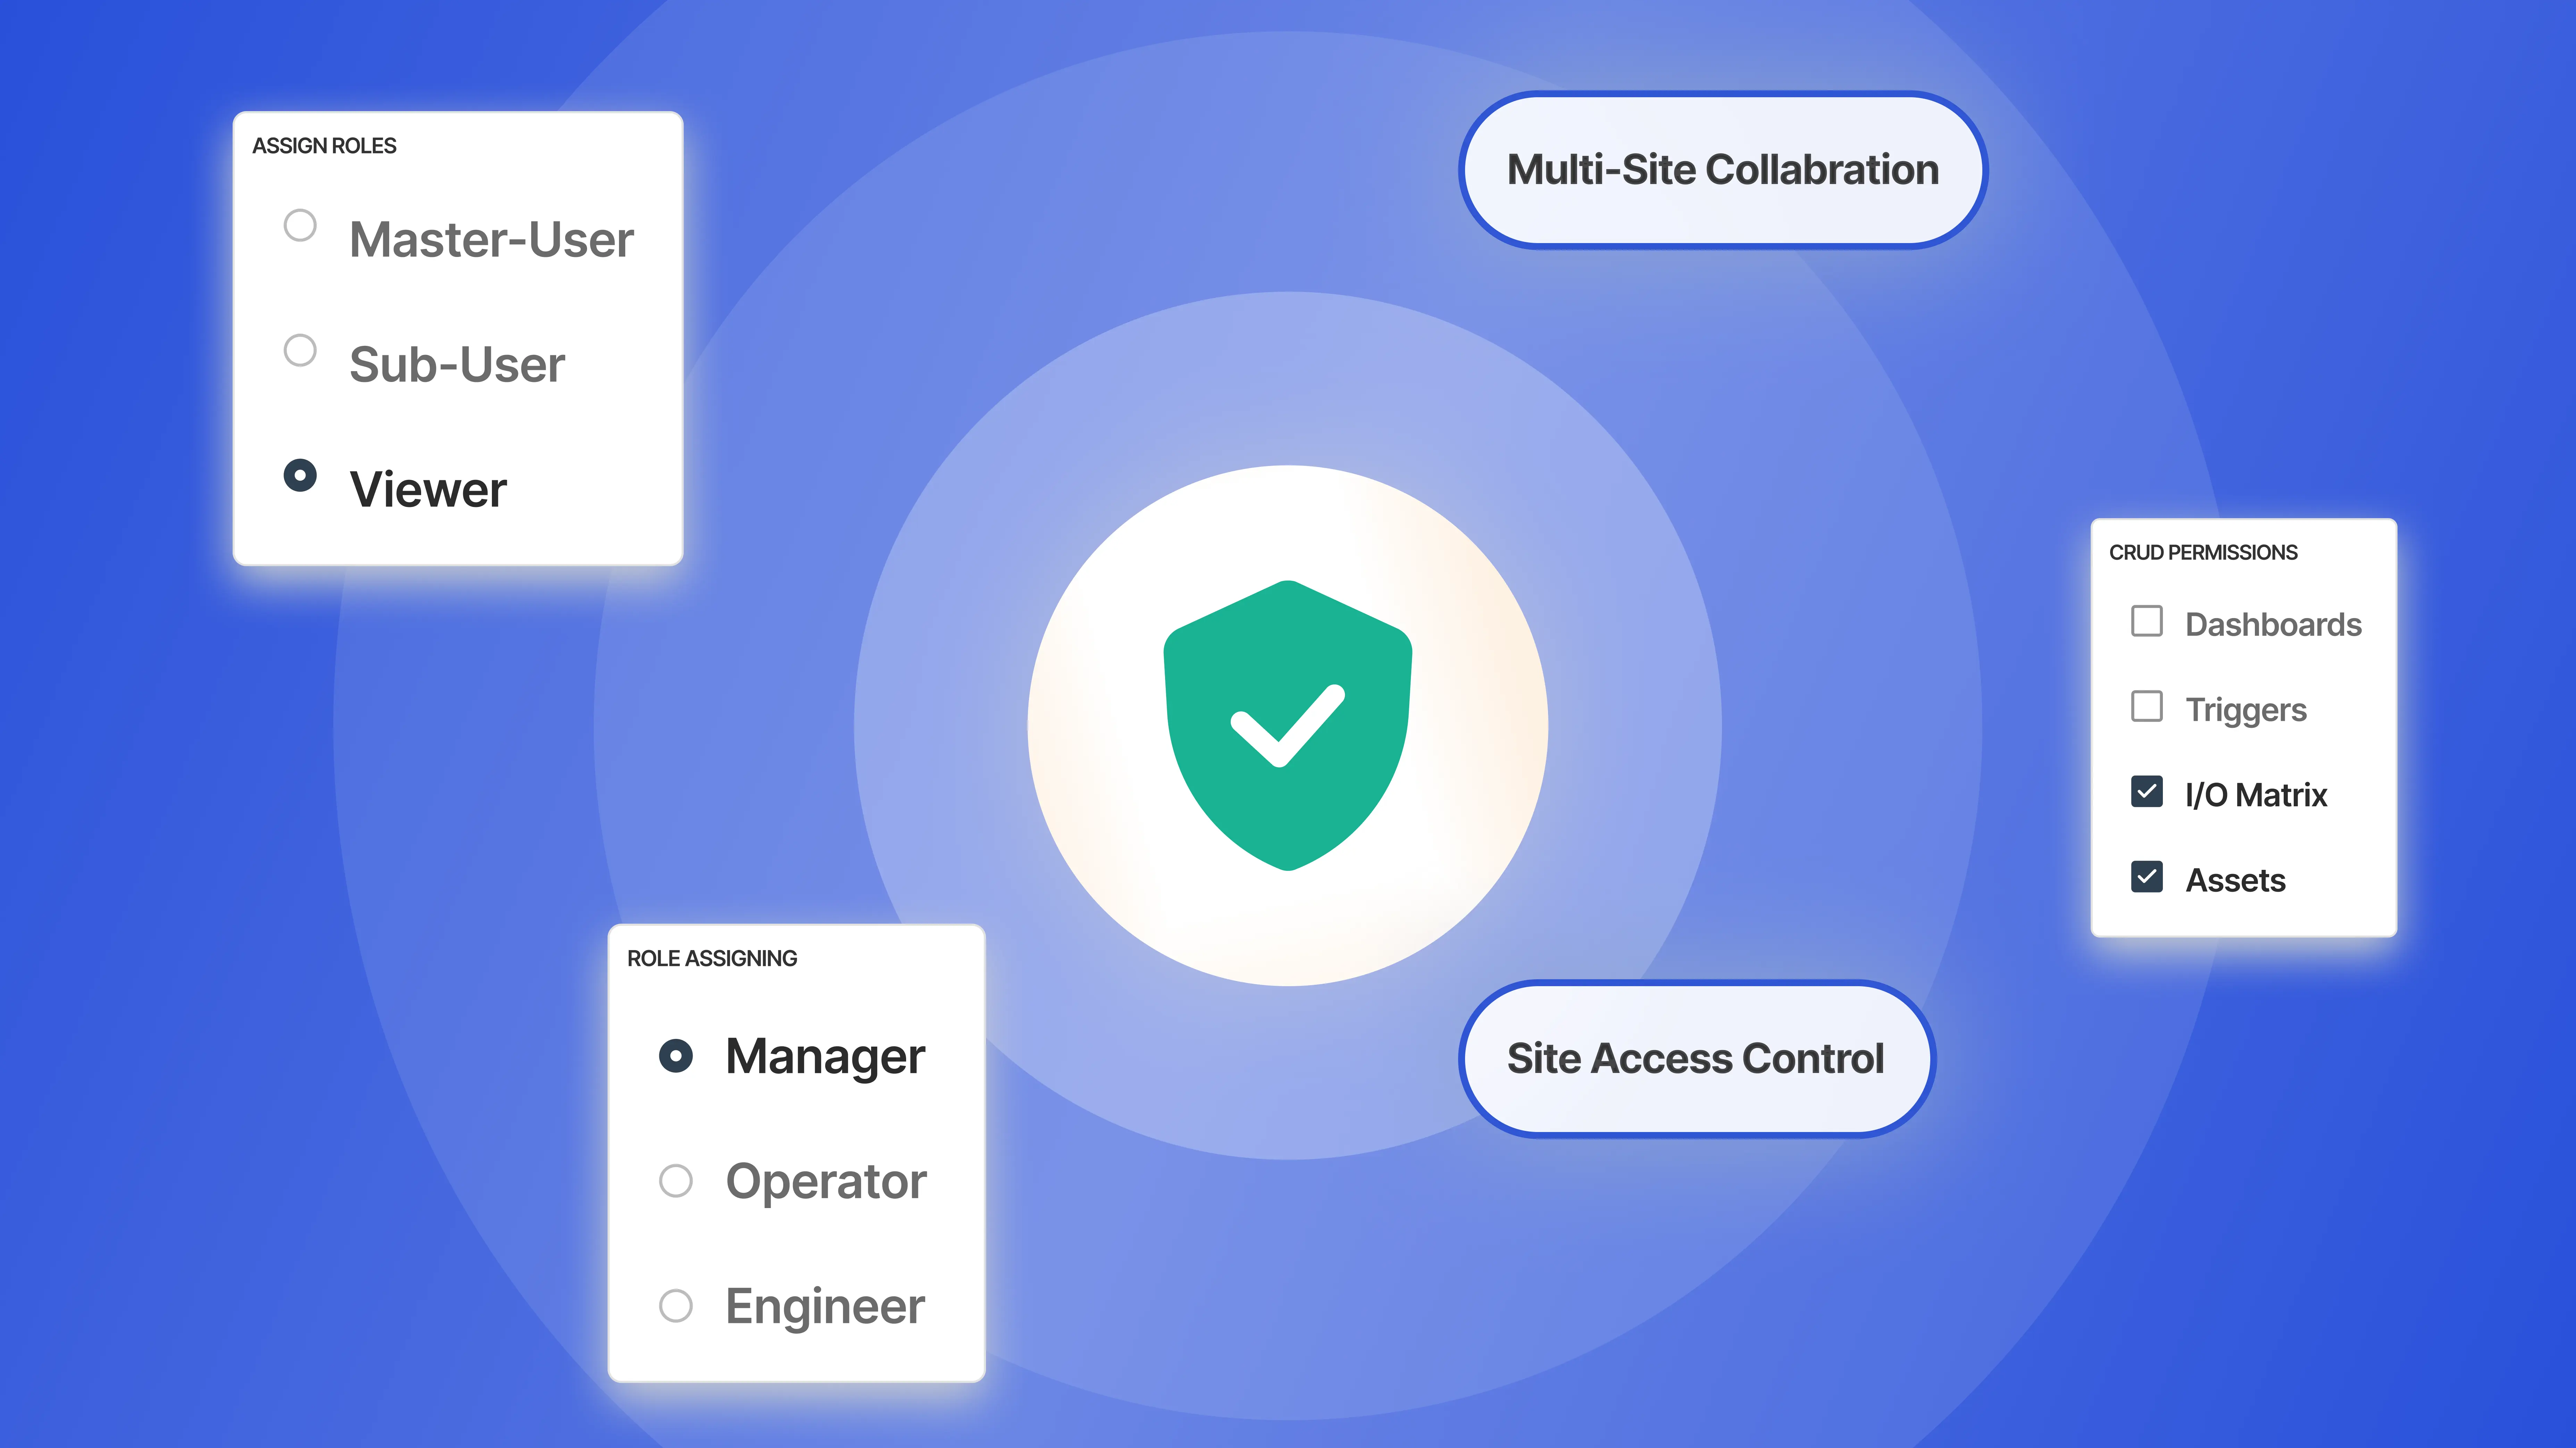
Secure, scalable visibility for everyone who needs it.
Assign roles: Operator, Engineer, Manager, Executive
Define CRUD permissions per dashboard, asset, or workflow
Control access across sites and organizational units
Share views without compromising data security
Enable multi-site collaboration in real time
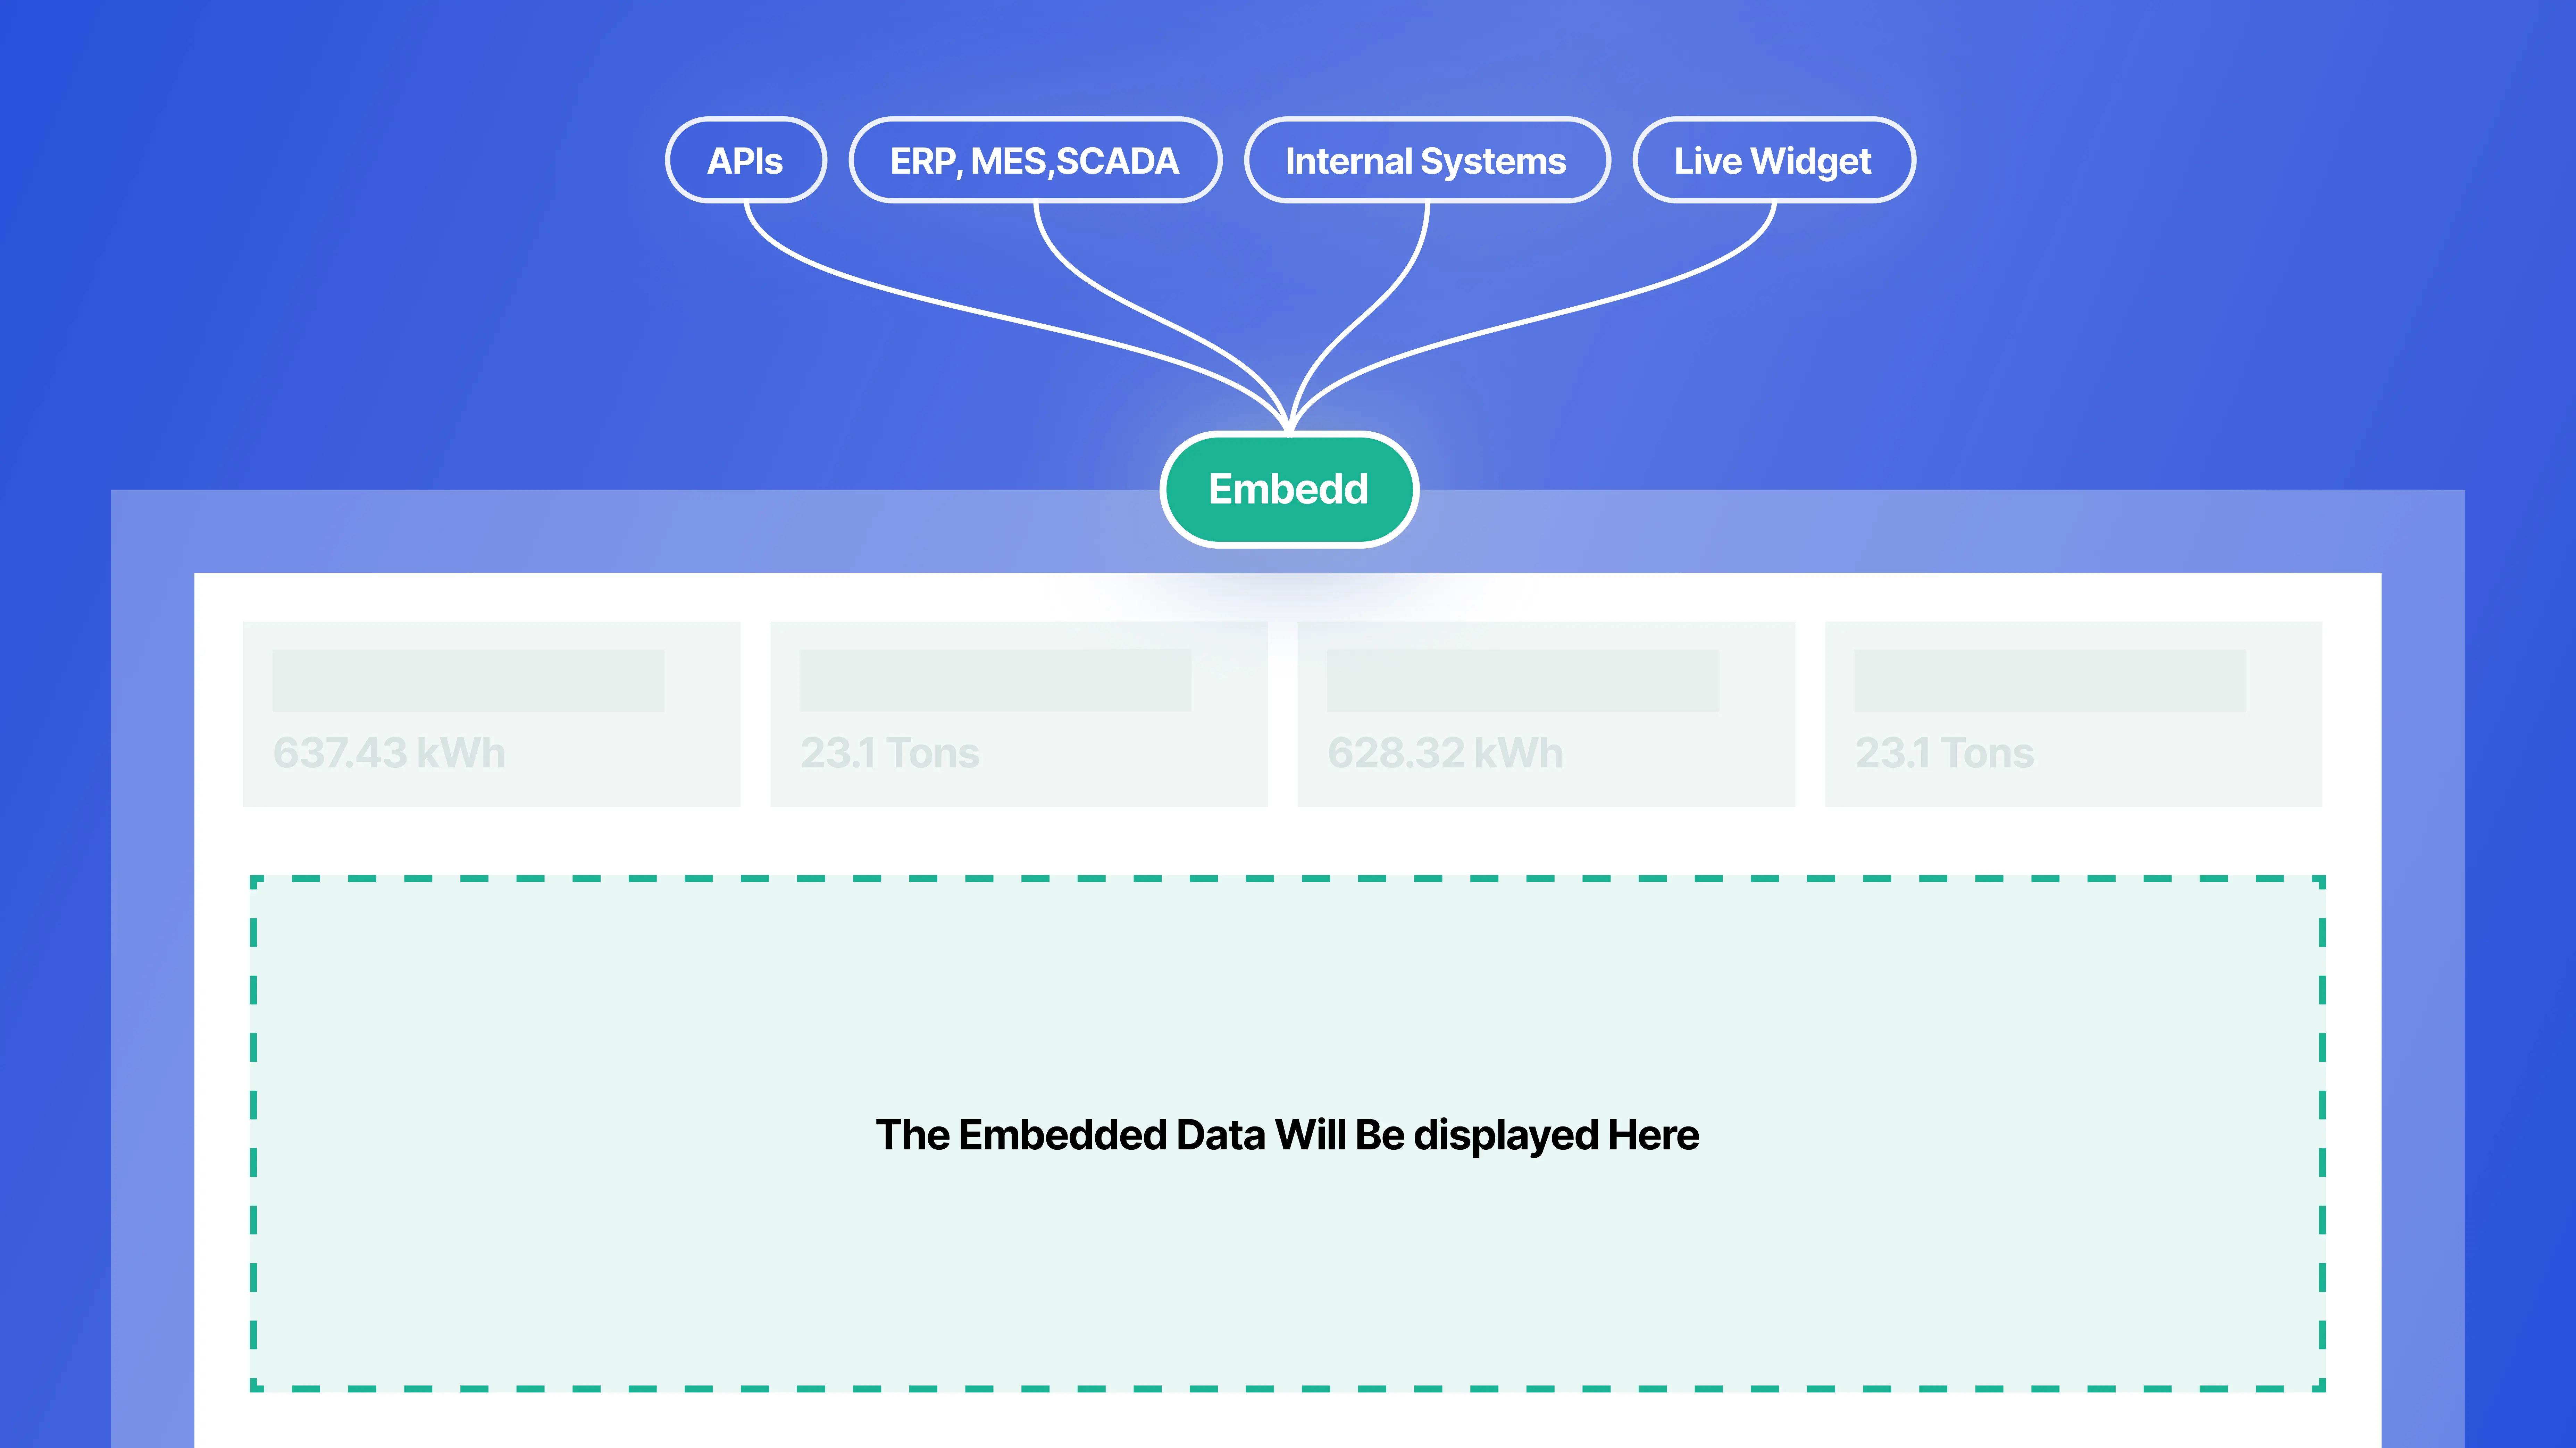
Extend your dashboards to where work happens.
Embed live widgets into portals, apps, or BI tools
Export visualizations to Power BI, Tableau, or internal systems
Connect with ERP, MES, or SCADA systems via APIs
Enable real-time insights across internal teams and tools
Build a unified intelligence layer for operations
Unlock real-time insights, predictive maintenance, and seamless machine connectivity—built for industrial performance at scale.


Discover how Faclon’s Industrial OS connects every asset, empowers every decision, and automates every operation all in one seamless demo experience