Join Our Lunch & Learn: How Agentic AI Will Transform Industrial Operations | Register Now →
.svg)
September 17, 2026
5 Mins
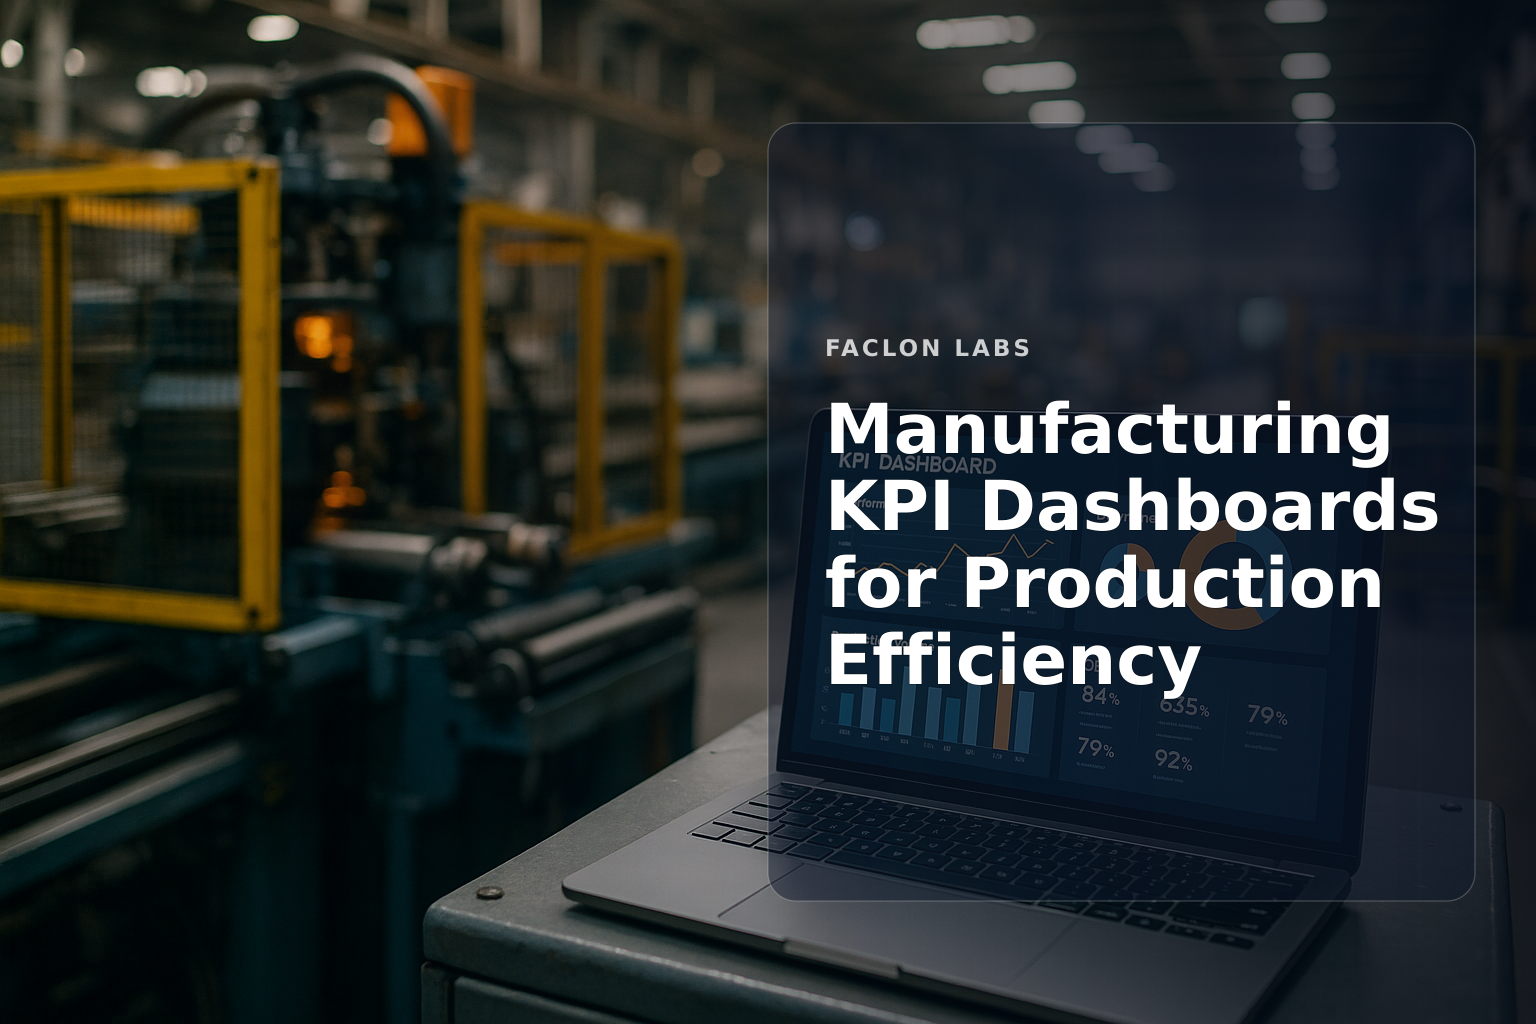
Manufacturing environments generate vast amounts of data daily, but without clear insight, this data rarely translates into meaningful action. A KPI dashboard serves as a centralized tool that transforms raw data into accessible visual summaries, helping production teams focus on what matters most for operational efficiency.
Understanding how KPI dashboards work and which metrics to track is essential for plant managers who want to improve productivity, reduce waste, and maintain quality standards. This post explains the fundamentals of manufacturing KPI dashboards and how they support continuous improvement efforts.
A KPI (Key Performance Indicator) dashboard is a visual management tool that aggregates critical performance metrics into an interactive display. It provides a snapshot of how manufacturing operations are performing against predefined targets, helping decision-makers quickly assess progress and identify issues.
Manufacturing KPI dashboards pull data from various sources such as machines, sensors, ERP systems, and quality control databases. This integration allows for a unified view of production performance without manually compiling reports from disparate systems.
Dashboards typically use charts, graphs, and trend lines to represent KPIs visually. These elements make complex data easier to interpret at a glance, revealing patterns like production bottlenecks or quality deviations that might be missed in raw data tables.
Unlike static reports that provide historical snapshots, KPI dashboards offer real-time or near-real-time updates. This immediacy supports proactive management rather than reactive analysis, enabling faster responses to operational changes [industry analysis].
Several KPIs are fundamental to tracking production efficiency:
These KPIs directly reflect the health of manufacturing processes. For example, OEE highlights equipment utilization and efficiency losses, while downtime pinpoints areas needing maintenance or process improvement. Together, they provide a balanced view of operational effectiveness.
Tracking these KPIs allows plants to optimize resource use, reduce waste, and increase output without sacrificing quality. They also help align daily operations with long-term business goals like cost reduction and customer satisfaction [manufacturing KPIs guide].
Real-time dashboards give plant managers immediate insight into current conditions, enabling swift action to minimize downtime or quality issues before they escalate.
Visual dashboards highlight anomalies and trends, reducing the time needed to diagnose problems. This accelerates root cause analysis and corrective measures.
Dashboards create a shared understanding of performance among operators, supervisors, and executives, fostering collaboration and accountability.
By continuously monitoring KPIs, dashboards provide feedback loops essential for lean manufacturing and Six Sigma programs [production KPI guide].
Automate data collection from machines, sensors, and software systems to ensure accuracy and timeliness. Use middleware or IIoT platforms to unify data streams.
| Section | Purpose | Visualization Type |
|---|---|---|
| Production Overview | Summarizes key metrics (OEE, throughput) | Gauges, line charts |
| Downtime Analysis | Details downtime causes and durations | Bar charts, pie charts |
| Quality Metrics | Tracks defect rates and inspection results | Trend lines, heat maps |
Effective dashboards balance high-level views with access to detailed data, supporting both quick checks and in-depth reviews [manufacturing dashboard guide].
Focus on KPIs that drive decision-making. Excessive metrics can overwhelm users and obscure critical insights.
Implement automated data collection and validation to maintain trust in dashboard outputs.
Involve end-users early in dashboard design to ensure relevance and usability, encouraging consistent use.
Manufacturing priorities evolve; review KPIs periodically to keep the dashboard aligned with current goals [production KPI guide].
Dashboards display OEE in real time, breaking it down into availability, performance, and quality components, making it easier to pinpoint efficiency losses.
Visualizing downtime events and their frequency helps identify problematic equipment or processes for targeted maintenance or improvement.
By monitoring trends and anomalies, teams can implement corrective actions focused on the most impactful issues, incrementally improving OEE [complete guide].
A KPI dashboard is a visual tool that consolidates key performance indicators into one interface, providing real-time insights into business or operational performance.
They enable faster problem detection, better communication, and data-driven decision-making, improving efficiency and quality on the production floor.
OEE, downtime, throughput, and quality rate are essential metrics that reflect equipment utilization, operational continuity, output volume, and product quality.
Yes, modern KPI dashboards often connect with IIoT platforms and other data sources to automate data collection and provide up-to-date performance views.
Dashboards should update as close to real time as possible to support timely decision-making, typically ranging from seconds to minutes depending on system capabilities [manufacturing KPIs].
For plant operations leaders aiming to improve production efficiency, investing time in understanding and implementing KPI dashboards is a foundational step. Start by identifying your critical KPIs and exploring integration options with your existing systems to unlock clearer insights and faster operational responses.
A KPI dashboard is a visual tool that consolidates key performance indicators into a single interface, allowing users to quickly assess business or operational performance through charts, graphs, and other visualizations.
They provide real-time visibility into critical production metrics, enabling plant leaders to identify inefficiencies, monitor equipment performance, and make data-driven decisions that improve overall production efficiency.
Key KPIs include Overall Equipment Effectiveness (OEE), machine downtime, throughput rate, quality rate, and cycle time, as these directly reflect the efficiency and effectiveness of manufacturing processes.
Yes, modern KPI dashboards can integrate data from industrial IoT devices and other data sources to provide up-to-date, comprehensive views of plant operations.
Dashboards should be updated in real time or near-real time to ensure decision-makers have the most current data, though update frequency may vary depending on operational needs and data availability.