Join Our Lunch & Learn: How Agentic AI Will Transform Industrial Operations | Register Now →
.svg)
August 19, 2026
5 Mins
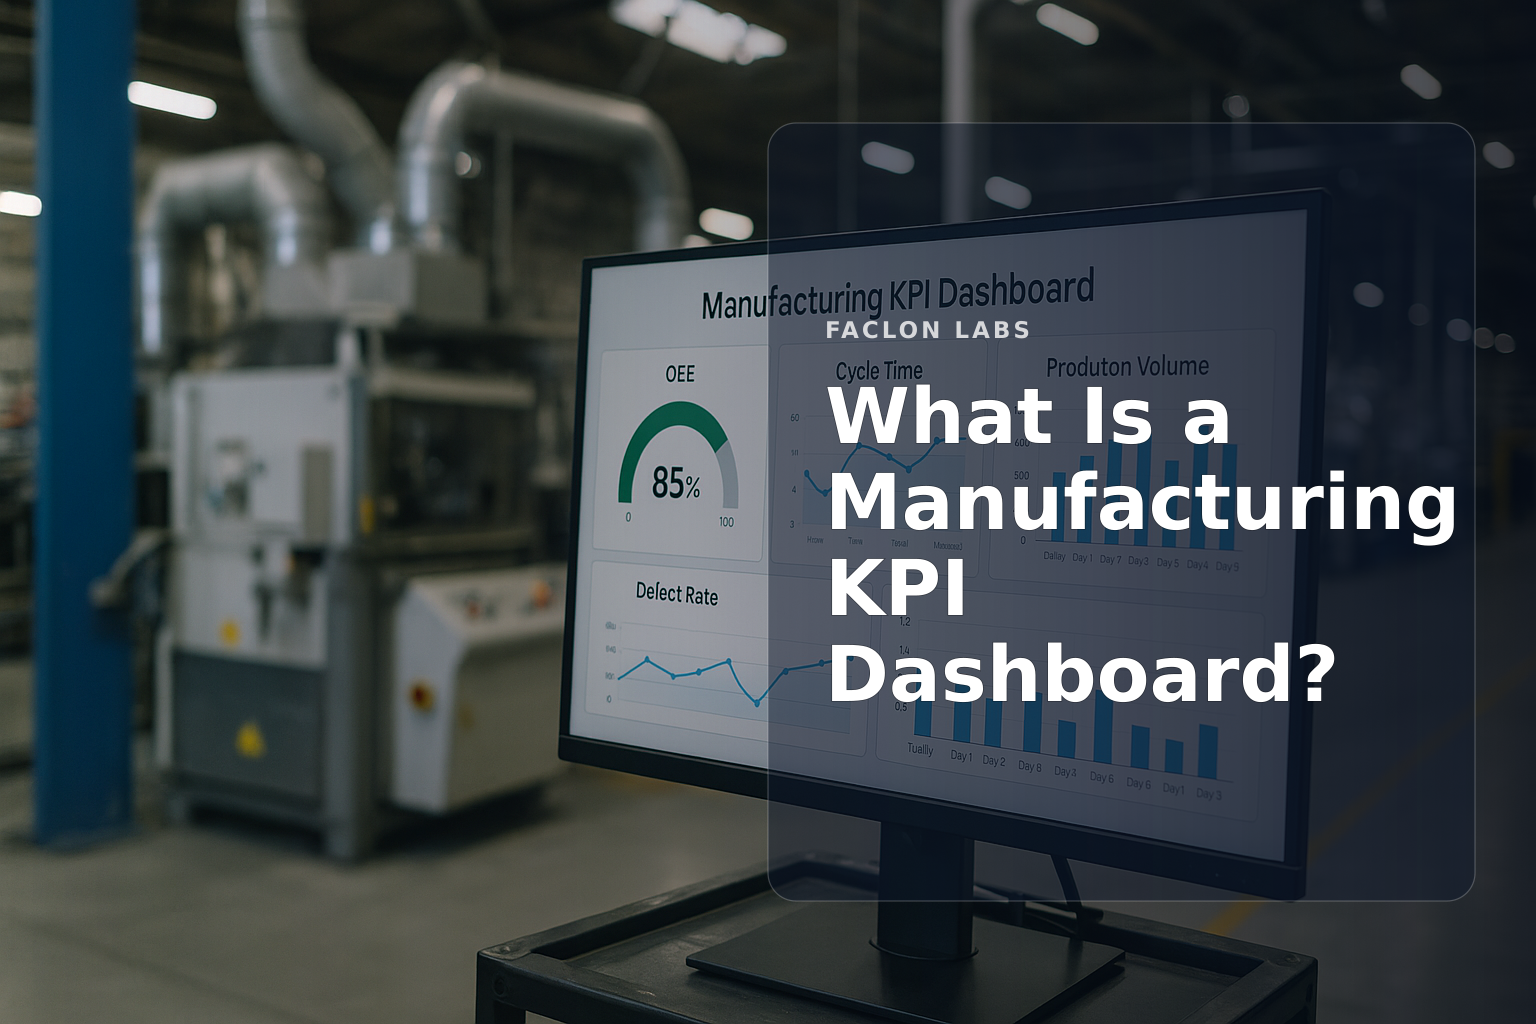
Manufacturing operations generate vast amounts of data daily, but raw data alone rarely drives effective decisions. Leaders need clear, actionable insights presented in a timely, accessible format. This is where manufacturing KPI dashboards come in—tools designed to visualize critical metrics at a glance, helping teams understand performance and identify issues immediately.
Understanding what a manufacturing KPI dashboard is and how it functions is essential for plant managers and operations leaders aiming to improve productivity and reduce costs. This article explains the concept, its importance, key metrics displayed, and best practices for implementation.
Originally, the term "dashboard" referred to a vehicle’s control panel displaying speed, fuel, and engine status. Today, a dashboard broadly means any visual interface that consolidates multiple data points into a single view for quick interpretation.
Dashboards serve as centralized panels that gather data from diverse sources and present it visually—using charts, graphs, gauges, and tables. This helps users quickly understand complex information without sifting through raw data or multiple reports.
Unlike static control panels, digital dashboards are interactive, customizable, and often update in real time. They can integrate data from various digital systems and allow users to drill down into specific metrics or time periods.
A manufacturing KPI dashboard applies the dashboard concept specifically to factory and plant operations. It provides a consolidated view of production-related metrics critical to manufacturing success.
These dashboards emphasize KPIs such as Overall Equipment Effectiveness (OEE), production throughput, downtime, quality rates, and maintenance metrics. These indicators reflect operational health and efficiency.
Manufacturing KPI dashboards pull data from multiple sources including Supervisory Control and Data Acquisition (SCADA) systems, Manufacturing Execution Systems (MES), Enterprise Resource Planning (ERP) software, and Industrial Internet of Things (IIoT) sensors. This integration provides a holistic view of plant performance.
By visualizing KPIs in real time, these dashboards empower leaders to identify bottlenecks, quality issues, or equipment failures quickly and respond proactively, improving overall plant performance and reducing waste How to Calculate and Improve OEE in Manufacturing.
Manufacturing KPI dashboards are indispensable because they provide:
Dashboards transform raw data into actionable insights, helping plant leaders make informed decisions that directly impact the bottom line.
Manufacturing KPI dashboards typically display a range of metrics essential for monitoring plant performance:
| KPI Category | Example Metrics | Description |
|---|---|---|
| Overall Equipment Effectiveness (OEE) | Availability, Performance, Quality | Measures how effectively equipment is utilized and producing quality output |
| Production Output | Units produced, throughput rate | Tracks volume of production over time |
| Downtime and Uptime | Downtime duration, uptime percentage | Monitors equipment availability and stoppages |
| Quality Metrics | Defect rate, First Pass Yield | Assesses product quality and production accuracy |
| Energy Consumption | kWh used per unit, resource utilization | Measures energy efficiency and resource use |
| Maintenance Metrics | Mean Time Between Failure (MTBF), Mean Time to Repair (MTTR) | Tracks reliability and repair efficiency |
These KPIs give a comprehensive picture of plant health and operational efficiency at a glance [[manufacturing dashboard guide]].
An effective dashboard seamlessly integrates data from IIoT sensors, MES, SCADA, ERP, and other plant systems, ensuring comprehensive and accurate information.
Visualizations should be chosen based on the KPI’s nature: line graphs for trends, gauges for thresholds, bar charts for comparisons, and tables for detailed data.
Dashboards should be customizable to different roles, providing operators with actionable alerts, supervisors with shift-level summaries, and managers with strategic overviews.
Automated alerts help users respond quickly to anomalies, such as equipment overheating or production falling below targets.
Dashboards must be accessible across devices and locations, from control rooms to mobile devices on the plant floor, enabling timely decision-making Generative AI Platforms: Capabilities, Applications, and Selection for Industrial AI.
Following these guidelines helps create a dashboard that truly supports operational excellence rather than just displaying data.
Manufacturing KPI dashboards are foundational tools for plant operations leaders aiming to improve efficiency and quality. Start by identifying your critical KPIs, then explore dashboard solutions that integrate seamlessly with your existing systems to unlock real-time insights. For more on optimizing industrial data visualization, explore our posts on How to Calculate and Improve OEE in Manufacturing and Benefits of Automated Maintenance Services for Industrial Plants.
The main purpose of a manufacturing KPI dashboard is to provide plant operations leaders with a centralized, real-time visual interface to monitor critical performance indicators, identify operational issues, and make informed decisions to improve efficiency, productivity, and profitability.
A manufacturing KPI dashboard typically displays data related to production output, OEE (Overall Equipment Effectiveness), machine uptime/downtime, quality metrics (e.g., defect rates), energy consumption, maintenance schedules, and other operational parameters critical to plant performance.
By offering real-time visibility into operations, a manufacturing KPI dashboard allows for immediate identification of inefficiencies, bottlenecks, and potential equipment failures. This enables proactive intervention, optimized resource allocation, and continuous process improvement, leading to significant gains in overall efficiency.
No, while related, a manufacturing KPI dashboard is not the same as a SCADA (Supervisory Control and Data Acquisition) system. SCADA systems focus on real-time control and monitoring of industrial processes at a granular level. A KPI dashboard aggregates and visualizes data from SCADA and other systems to provide a higher-level, strategic overview of performance for decision-makers, rather than direct control.